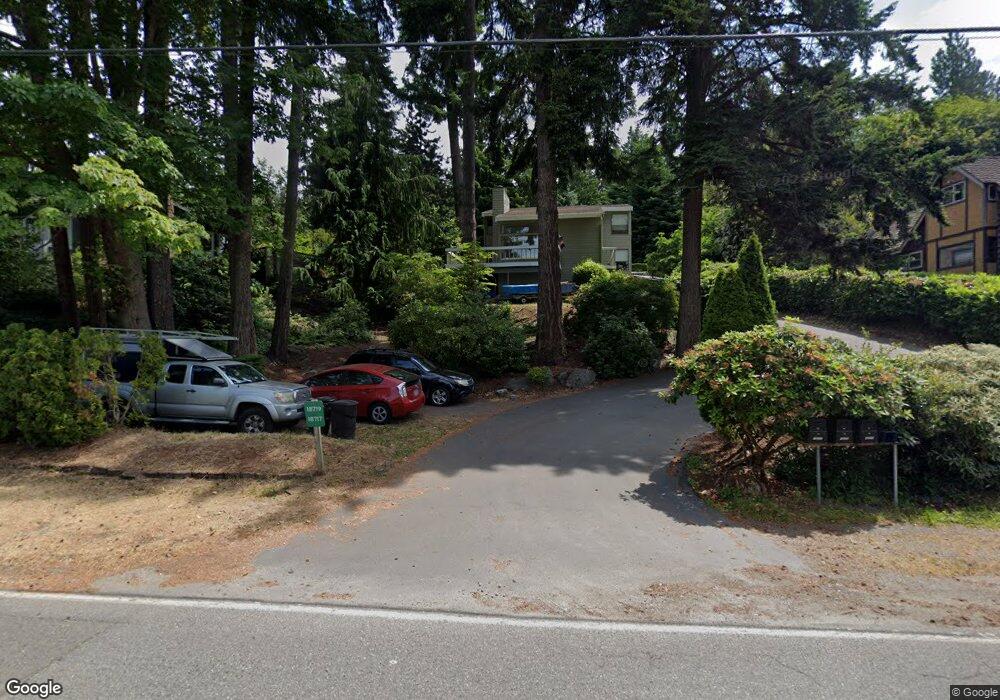
18717 Olympic View Dr Edmonds, WA 98020
Edmonds Bowl NeighborhoodEstimated Value: $1,494,348 - $1,583,000
4
Beds
3
Baths
2,412
Sq Ft
$637/Sq Ft
Est. Value
About This Home
This home is located at 18717 Olympic View Dr, Edmonds, WA 98020 and is currently estimated at $1,536,087, approximately $636 per square foot. 18717 Olympic View Dr is a home located in Snohomish County with nearby schools including Seaview Elementary School, Meadowdale Middle School, and Meadowdale High School.
Ownership History
Date
Name
Owned For
Owner Type
Purchase Details
Closed on
Jun 3, 2019
Sold by
Ridley Charles M and Ridley Marcia Chan
Bought by
Ridley Charles M and Ridley Marcia C
Current Estimated Value
Purchase Details
Closed on
Jul 9, 2004
Sold by
Berning Wallace B and Berning Nancy G
Bought by
Ridley Charles M and Ridley Marcia Chan
Home Financials for this Owner
Home Financials are based on the most recent Mortgage that was taken out on this home.
Original Mortgage
$408,000
Outstanding Balance
$198,655
Interest Rate
6.27%
Mortgage Type
Purchase Money Mortgage
Estimated Equity
$1,337,432
Purchase Details
Closed on
Sep 18, 2002
Sold by
Berning Wallace B and Berning Nancy G
Bought by
Berning Wallace B and Berning Nancy G
Home Financials for this Owner
Home Financials are based on the most recent Mortgage that was taken out on this home.
Original Mortgage
$277,000
Interest Rate
5.25%
Purchase Details
Closed on
Sep 17, 2001
Sold by
Berning Wallace B and Berning Nancy G
Bought by
Berning Wallace B and Berning Nancy G
Create a Home Valuation Report for This Property
The Home Valuation Report is an in-depth analysis detailing your home's value as well as a comparison with similar homes in the area
Home Values in the Area
Average Home Value in this Area
Purchase History
| Date | Buyer | Sale Price | Title Company |
|---|---|---|---|
| Ridley Charles M | -- | None Available | |
| Ridley Charles M | $510,000 | Chicago Title Insurance Co | |
| Berning Wallace B | -- | -- | |
| Berning Wallace B | -- | -- |
Source: Public Records
Mortgage History
| Date | Status | Borrower | Loan Amount |
|---|---|---|---|
| Open | Ridley Charles M | $408,000 | |
| Previous Owner | Berning Wallace B | $277,000 |
Source: Public Records
Tax History
| Year | Tax Paid | Tax Assessment Tax Assessment Total Assessment is a certain percentage of the fair market value that is determined by local assessors to be the total taxable value of land and additions on the property. | Land | Improvement |
|---|---|---|---|---|
| 2025 | $8,635 | $1,334,700 | $878,800 | $455,900 |
| 2024 | $8,635 | $1,212,300 | $778,100 | $434,200 |
| 2023 | $8,439 | $1,227,700 | $727,400 | $500,300 |
| 2022 | $7,202 | $861,400 | $436,400 | $425,000 |
| 2020 | $6,687 | $715,300 | $345,500 | $369,800 |
| 2019 | $6,489 | $699,200 | $338,000 | $361,200 |
| 2018 | $6,870 | $639,700 | $312,100 | $327,600 |
| 2017 | $6,285 | $612,400 | $308,900 | $303,500 |
| 2016 | $5,944 | $573,800 | $283,500 | $290,300 |
| 2015 | $5,641 | $512,700 | $243,900 | $268,800 |
| 2013 | $4,651 | $398,600 | $176,000 | $222,600 |
Source: Public Records
Map
Nearby Homes
- 192 XX Olympic View Dr
- 18726 92nd Ave W
- 9125 188th St SW
- 19303 Olympic View Dr
- 18710 88th Ave W
- 8718 189th Place SW
- 9225 Olympic View Dr
- 8615 194th Place SW
- 19523 86th Ave W Unit 523
- 8516 196th St SW Unit 105
- 8516 196th St SW Unit 302
- 8516 196th St SW Unit 311
- 910 9th Ave N
- 8523 199th Place SW
- 8504 199th Place SW
- 8427 200th St SW
- 611 3rd Ave N
- 7821 196th St SW Unit B
- 603 7th Ave N Unit A306
- 18757 76th Ave W
- 18715 Olympic View Dr
- 18719 Olympic View Dr
- 91 XX Olympic View Dr
- 0 Lot 1+2 Olympic View Dr
- 86 XX Olympic View Dr
- 18811 Olympic View Dr
- 18711 Olympic View Dr
- 18809 Olympic View Dr
- 191 Xx 94th Ave W
- 191 94th Ave W
- 9602 Wharf St
- 18709 Olympic View Dr
- 18823 Olympic View Dr
- 18812 Olympic View Dr
- 9606 Wharf St
- 18707 Olympic View Dr
- 18819 Olympic View Dr
- 18711 Sound View Place
- 18631 Olympic View Dr
- 18703 Sound View Place
Your Personal Tour Guide
Ask me questions while you tour the home.