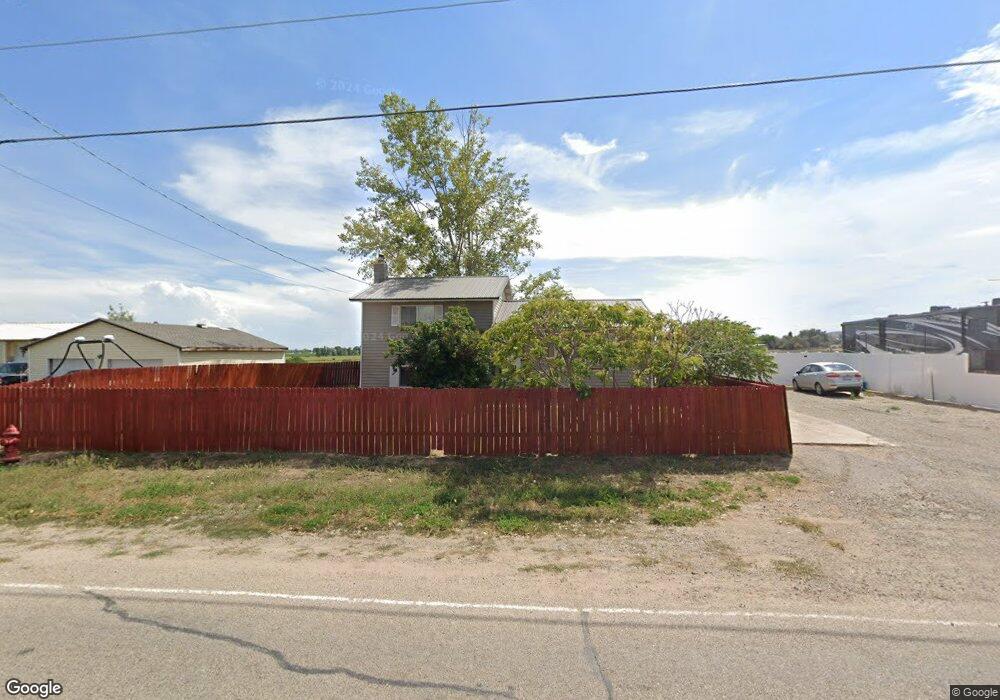
1872 E 3500 S Vernal, UT 84078
Estimated Value: $284,000 - $324,321
3
Beds
2
Baths
1,500
Sq Ft
$206/Sq Ft
Est. Value
About This Home
This home is located at 1872 E 3500 S, Vernal, UT 84078 and is currently estimated at $309,580, approximately $206 per square foot. 1872 E 3500 S is a home located in Uintah County with nearby schools including Davis School, Vernal Middle School, and Uintah Middle School.
Ownership History
Date
Name
Owned For
Owner Type
Purchase Details
Closed on
Jul 11, 2024
Sold by
Odriscoll Daniel and Odriscoll Amanda
Bought by
Buist Aidan
Current Estimated Value
Home Financials for this Owner
Home Financials are based on the most recent Mortgage that was taken out on this home.
Original Mortgage
$253,326
Outstanding Balance
$250,323
Interest Rate
7.03%
Mortgage Type
FHA
Estimated Equity
$59,257
Purchase Details
Closed on
Jan 31, 2008
Sold by
Evans Skyler D
Bought by
Evans Skyler D
Home Financials for this Owner
Home Financials are based on the most recent Mortgage that was taken out on this home.
Original Mortgage
$171,636
Interest Rate
6.04%
Mortgage Type
FHA
Purchase Details
Closed on
Sep 13, 2006
Sold by
Slaugh Craig D and Slaugh Jessica
Bought by
Evans Skyler D
Home Financials for this Owner
Home Financials are based on the most recent Mortgage that was taken out on this home.
Original Mortgage
$161,000
Interest Rate
9.5%
Mortgage Type
Adjustable Rate Mortgage/ARM
Create a Home Valuation Report for This Property
The Home Valuation Report is an in-depth analysis detailing your home's value as well as a comparison with similar homes in the area
Purchase History
| Date | Buyer | Sale Price | Title Company |
|---|---|---|---|
| Buist Aidan | -- | Truly Title | |
| Evans Skyler D | -- | -- | |
| Evans Skyler D | -- | -- |
Source: Public Records
Mortgage History
| Date | Status | Borrower | Loan Amount |
|---|---|---|---|
| Open | Buist Aidan | $253,326 | |
| Previous Owner | Evans Skyler D | $171,636 | |
| Previous Owner | Evans Skyler D | $161,000 |
Source: Public Records
Tax History
| Year | Tax Paid | Tax Assessment Tax Assessment Total Assessment is a certain percentage of the fair market value that is determined by local assessors to be the total taxable value of land and additions on the property. | Land | Improvement |
|---|---|---|---|---|
| 2024 | $1,254 | $144,498 | $18,768 | $125,730 |
| 2023 | $1,214 | $117,768 | $18,768 | $99,000 |
| 2022 | $1,011 | $97,968 | $18,768 | $79,200 |
| 2021 | $1,065 | $46,622 | $10,322 | $36,300 |
| 2020 | $1,051 | $85,872 | $19,250 | $66,622 |
| 2019 | $1,010 | $81,514 | $19,250 | $62,264 |
| 2018 | $972 | $78,549 | $19,250 | $59,299 |
| 2017 | $10 | $78,549 | $19,250 | $59,299 |
| 2016 | $982 | $87,175 | $19,250 | $67,925 |
| 2015 | $880 | $84,747 | $19,250 | $65,497 |
| 2014 | $837 | $81,628 | $19,250 | $62,378 |
| 2013 | $855 | $81,628 | $19,250 | $62,378 |
Source: Public Records
Map
Nearby Homes
- 2308 E Highway 40
- 1676 E 4000 S
- 3310 S 2500 E
- 2636 E 3950 S
- 2658 E 3950 S
- 4361 S 2280 E
- 1801 E 4500 S
- 1676 E 2500 S
- 1500 E 2500 S
- 709 E 2970 S
- 2685 S 500 E
- 3311 E 3500 S Unit 3
- 3331 E 3500 S Unit 4
- 392 E 2900 S
- 4977 S 2625 E
- 2102 E 1820 S
- 3541 U S Highway 40
- 3147 S Vernal Ave
- 163 E 2800 S
- 1550 S 800 E Unit 19
Your Personal Tour Guide
Ask me questions while you tour the home.