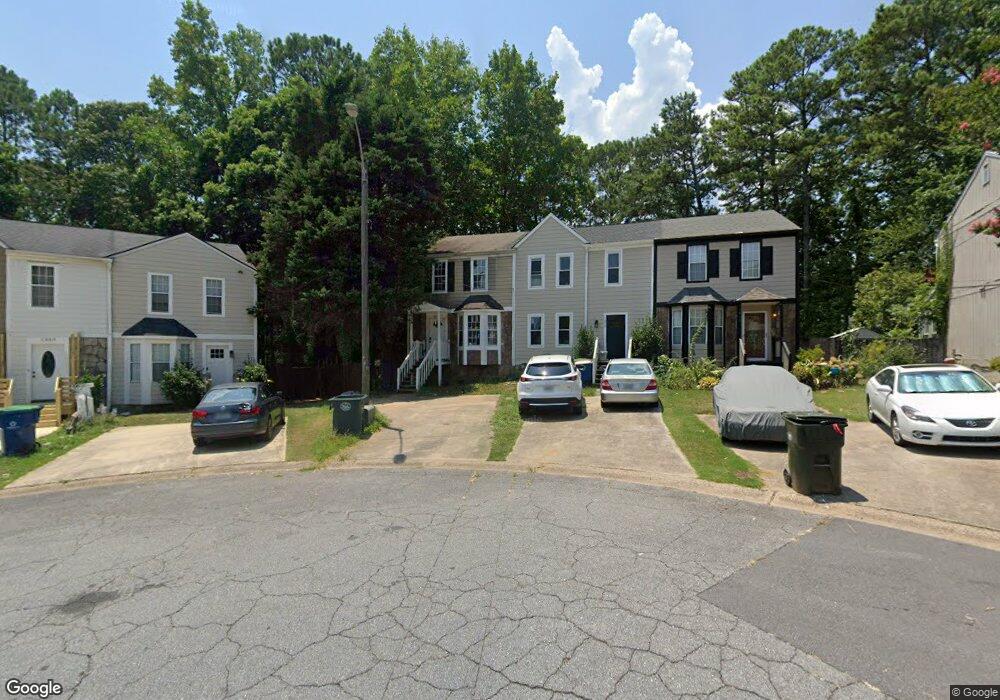
1872 Grant Ct NW Kennesaw, GA 30144
Estimated Value: $232,000 - $270,000
2
Beds
3
Baths
1,162
Sq Ft
$212/Sq Ft
Est. Value
About This Home
This home is located at 1872 Grant Ct NW, Kennesaw, GA 30144 and is currently estimated at $246,344, approximately $212 per square foot. 1872 Grant Ct NW is a home located in Cobb County with nearby schools including Kennesaw Elementary School, Big Shanty Elementary School, and Palmer Middle School.
Ownership History
Date
Name
Owned For
Owner Type
Purchase Details
Closed on
Mar 25, 2022
Sold by
Julio Dujarric
Bought by
Dujarric Julio and Perez Jeannette
Current Estimated Value
Purchase Details
Closed on
Aug 3, 2012
Sold by
Peachtree City Financial L
Bought by
Dujarric Julio and Perez Jeannette
Purchase Details
Closed on
Jul 20, 2012
Sold by
Ulph Land Rust
Bought by
Peachtree City Financial Llc
Purchase Details
Closed on
Jul 3, 2012
Sold by
Petakos Llc
Bought by
Vargas Melanie and Ulph Land Rust
Purchase Details
Closed on
Sep 15, 2008
Sold by
Petakos Peter C
Bought by
Petakos Llc
Purchase Details
Closed on
Sep 17, 2001
Sold by
Gregorakos Mary T
Bought by
Petakos Peter C
Purchase Details
Closed on
Jan 31, 1996
Sold by
Kuhn Gary C
Bought by
Lyttle Patricia L
Create a Home Valuation Report for This Property
The Home Valuation Report is an in-depth analysis detailing your home's value as well as a comparison with similar homes in the area
Home Values in the Area
Average Home Value in this Area
Purchase History
| Date | Buyer | Sale Price | Title Company |
|---|---|---|---|
| Dujarric Julio | -- | None Listed On Document | |
| Dujarric Julio | $35,000 | -- | |
| Peachtree City Financial Llc | $27,000 | -- | |
| Vargas Melanie | $20,000 | -- | |
| Petakos Llc | $1,000 | -- | |
| Petakos Peter C | -- | -- | |
| Lyttle Patricia L | $62,600 | -- |
Source: Public Records
Mortgage History
| Date | Status | Borrower | Loan Amount |
|---|---|---|---|
| Closed | Lyttle Patricia L | $0 |
Source: Public Records
Tax History Compared to Growth
Tax History
| Year | Tax Paid | Tax Assessment Tax Assessment Total Assessment is a certain percentage of the fair market value that is determined by local assessors to be the total taxable value of land and additions on the property. | Land | Improvement |
|---|---|---|---|---|
| 2025 | $2,880 | $95,588 | $20,800 | $74,788 |
| 2024 | $2,882 | $95,588 | $20,800 | $74,788 |
| 2023 | $2,474 | $82,044 | $20,800 | $61,244 |
| 2022 | $2,229 | $73,456 | $19,200 | $54,256 |
| 2021 | $1,623 | $53,468 | $12,000 | $41,468 |
| 2020 | $1,737 | $43,592 | $12,000 | $31,592 |
| 2019 | $1,323 | $43,592 | $12,000 | $31,592 |
| 2018 | $1,128 | $37,168 | $10,000 | $27,168 |
| 2017 | $1,011 | $35,168 | $8,000 | $27,168 |
| 2016 | $809 | $28,124 | $6,000 | $22,124 |
| 2015 | $412 | $13,968 | $7,128 | $6,840 |
| 2014 | $415 | $13,968 | $0 | $0 |
Source: Public Records
Map
Nearby Homes
- 3435 Grant Dr NW
- 3341 Verdi Ln
- 3322 Cranston Ln
- 1861 Grant Ct NW Unit 2
- 1856 Grant Ct NW
- 3455 Lee Ct NW Unit 2
- 3478 Lee Ct NW
- 3354 Cranston Ln
- 3352 Cranston Ln
- 3346 Cranston Ln
- 3344 Cranston Ln
- 3342 Cranston Ln
- 3336 Cranston Ln
- Cooke Plan at East Park Village
- Kaufman Plan at East Park Village
- 3374 Verdi Ln
- 1915 Cassia Aly
- 1919 Appian Aly
- 1920 Appian Aly
- 1545 Kennesaw Trace Ct NW
- 1872 Grant Ct NW Unit 1872
- 1870 Grant Ct NW
- 1871 Grant Ct NW Unit II
- 1871 Grant Ct NW
- 1871 Grant Ct NW
- 1871 Grant Ct NW Unit 1871
- 1868 Grant Ct NW
- 1869 Grant Ct NW
- 1869 Grant Ct NW Unit 1869
- 1867 Grant Ct NW
- 1866 Grant Ct NW
- 1864 Grant Ct NW
- 1865 Grant Ct NW
- 1865 Grant Ct NW Unit 11
- 2175 Grant Ct
- 1863 Grant Ct NW
- 3465 Grant Dr NW
- 3478 Grant Dr NW
- 1713 Timber Ln NW
- 1859 Grant Ct NW