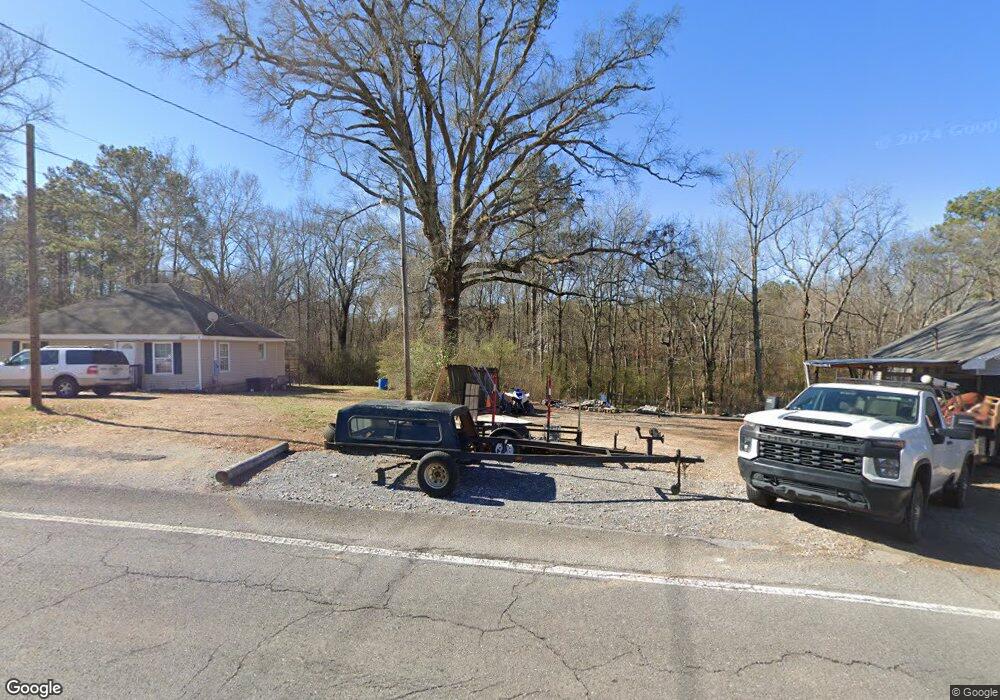
1872 Wax Rd SE Silver Creek, GA 30173
Estimated Value: $49,362 - $228,000
--
Bed
--
Bath
862
Sq Ft
$155/Sq Ft
Est. Value
About This Home
This home is located at 1872 Wax Rd SE, Silver Creek, GA 30173 and is currently estimated at $133,341, approximately $154 per square foot. 1872 Wax Rd SE is a home located in Floyd County with nearby schools including Pepperell Middle School and Pepperell High School.
Ownership History
Date
Name
Owned For
Owner Type
Purchase Details
Closed on
Nov 25, 2008
Sold by
Exclusive Inc
Bought by
Contract Asset Management Llc
Current Estimated Value
Purchase Details
Closed on
Jul 2, 2003
Bought by
Exclusive Inc
Purchase Details
Closed on
Jul 1, 2003
Sold by
Adams Glenda B
Bought by
Brown William A Jr Trustee Of The Glenda
Purchase Details
Closed on
Jun 27, 2003
Sold by
Preston Donald
Bought by
Adams Glenda B
Purchase Details
Closed on
Jan 31, 2001
Sold by
Preston Donald and Preston Heather B
Bought by
Preston Donald
Purchase Details
Closed on
Jan 3, 2001
Bought by
P and R
Purchase Details
Closed on
Jul 24, 1998
Sold by
Freeman George C and Freeman Shirley L
Bought by
Preston Donald and Preston Heather B
Purchase Details
Closed on
Jun 3, 1998
Sold by
Fuller Darwyn C and Fuller Marcus D
Bought by
Freeman George C and Freema Shirley L
Purchase Details
Closed on
Jul 1, 1997
Bought by
P and R
Purchase Details
Closed on
Jun 25, 1991
Bought by
P and R
Create a Home Valuation Report for This Property
The Home Valuation Report is an in-depth analysis detailing your home's value as well as a comparison with similar homes in the area
Home Values in the Area
Average Home Value in this Area
Purchase History
| Date | Buyer | Sale Price | Title Company |
|---|---|---|---|
| Contract Asset Management Llc | $24,479 | -- | |
| Exclusive Inc | -- | -- | |
| Brown William A Jr Trustee Of The Glenda | -- | -- | |
| -- | -- | -- | |
| Adams Glenda B | $22,500 | -- | |
| Preston Donald | -- | -- | |
| P | -- | -- | |
| Preston Donald | $18,000 | -- | |
| Freeman George C | -- | -- | |
| P | -- | -- | |
| P | -- | -- | |
| Fuller Darwyn C | -- | -- |
Source: Public Records
Tax History Compared to Growth
Tax History
| Year | Tax Paid | Tax Assessment Tax Assessment Total Assessment is a certain percentage of the fair market value that is determined by local assessors to be the total taxable value of land and additions on the property. | Land | Improvement |
|---|---|---|---|---|
| 2024 | $461 | $14,698 | $5,628 | $9,070 |
| 2023 | $421 | $13,772 | $5,117 | $8,655 |
| 2022 | $328 | $11,065 | $4,094 | $6,971 |
| 2021 | $309 | $10,224 | $4,094 | $6,130 |
| 2020 | $267 | $8,784 | $3,070 | $5,714 |
| 2019 | $251 | $8,358 | $3,070 | $5,288 |
| 2018 | $235 | $7,824 | $3,070 | $4,754 |
| 2017 | $228 | $7,575 | $3,070 | $4,505 |
| 2016 | $226 | $7,408 | $3,040 | $4,368 |
| 2015 | $221 | $7,408 | $3,040 | $4,368 |
| 2014 | $221 | $7,408 | $3,040 | $4,368 |
Source: Public Records
Map
Nearby Homes
- 110 Williams Rd SE
- 52 Lloyd Dr SE
- 463 Compton Rd SE
- 2557 Wax Rd SE
- 12 Lakemont Dr SE
- 16 Hardin Dr SE
- 1337 Abrams Rd SE
- 894 Wax Rd SE
- 1424 Harmony Rd SE
- 838 Pleasant Hope Rd SE
- 682 Wax Rd SE
- 150 Pleasant Hope Rd SE
- 5712 Rockmart Rd SE
- 1531 Old Rockmart Rd SE
- 1561 Pleasant Valley Rd SE
- 4622 Rockmart Rd SE
- 550 Donahoo Rd SE
- 4682 Rockmart Rd SE
- 1062 Bethel Church Rd SE
- 1145 Old Rockmart Rd SE
- 1856 Wax Rd SE
- 1884 Wax Rd SE
- 1898 Wax Rd SE
- 622 Harmony Rd SE
- 1901 Wax Rd SE
- 1846 Wax Rd SE
- 590 Harmony Rd SE
- 1889 Wax Rd SE
- 1904 Wax Rd SE
- 1832 Wax Rd SE
- 1841 Wax Rd SE
- 1889 Wax Rd SE
- 1776 Wax Rd SE
- 1776 Wax Rd SE
- 2238 Wax Rd SE Unit A
- 2238 Wax Rd SE
- 622 Harmony Rd SE
- 1791 Wax Rd SE
- 1786 Wax Rd SE
- 421 Harmony Rd SE