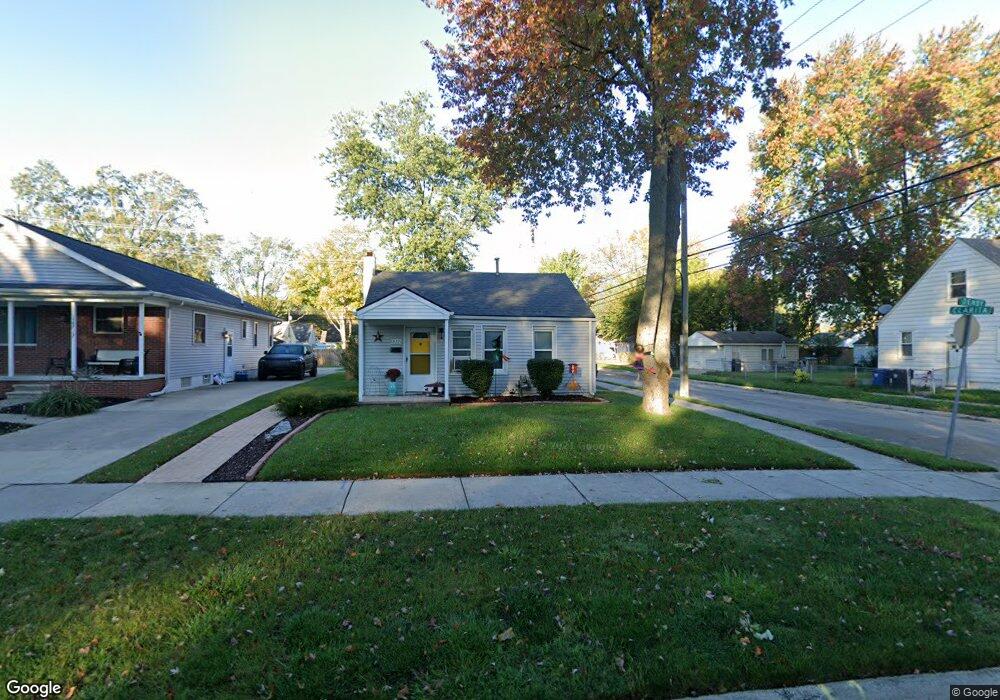
18721 Denby Redford, MI 48240
Estimated Value: $100,951 - $153,000
--
Bed
--
Bath
645
Sq Ft
$188/Sq Ft
Est. Value
About This Home
This home is located at 18721 Denby, Redford, MI 48240 and is currently estimated at $121,488, approximately $188 per square foot. 18721 Denby is a home located in Wayne County with nearby schools including Beech Elementary School, Hilbert Middle School, and Redford Union High School.
Ownership History
Date
Name
Owned For
Owner Type
Purchase Details
Closed on
Mar 4, 2025
Sold by
Marshall Ginger A
Bought by
Marshall Ginger A and Morris Robert
Current Estimated Value
Purchase Details
Closed on
Aug 21, 2017
Sold by
Stevens Denise
Bought by
Marshall Ginger A
Purchase Details
Closed on
May 22, 2003
Sold by
Rescoe John N
Bought by
Taylor Ginger A
Purchase Details
Closed on
Jul 24, 2001
Sold by
Henkel Dean
Bought by
Howse Brian
Purchase Details
Closed on
Apr 14, 1998
Sold by
Stringer Sandra
Bought by
Rescoe John N
Create a Home Valuation Report for This Property
The Home Valuation Report is an in-depth analysis detailing your home's value as well as a comparison with similar homes in the area
Home Values in the Area
Average Home Value in this Area
Purchase History
| Date | Buyer | Sale Price | Title Company |
|---|---|---|---|
| Marshall Ginger A | -- | None Listed On Document | |
| Marshall Ginger A | -- | None Listed On Document | |
| Marshall Ginger A | -- | None Available | |
| Taylor Ginger A | $85,000 | Michigan Title Insurance Age | |
| Howse Brian | $86,000 | -- | |
| Rescoe John N | $54,000 | -- |
Source: Public Records
Tax History Compared to Growth
Tax History
| Year | Tax Paid | Tax Assessment Tax Assessment Total Assessment is a certain percentage of the fair market value that is determined by local assessors to be the total taxable value of land and additions on the property. | Land | Improvement |
|---|---|---|---|---|
| 2025 | $477 | $47,000 | $0 | $0 |
| 2024 | $477 | $42,600 | $0 | $0 |
| 2023 | $455 | $37,000 | $0 | $0 |
| 2022 | $1,216 | $32,700 | $0 | $0 |
| 2021 | $1,182 | $31,300 | $0 | $0 |
| 2020 | $1,167 | $28,000 | $0 | $0 |
| 2019 | $1,144 | $23,900 | $0 | $0 |
| 2018 | $410 | $19,500 | $0 | $0 |
| 2017 | $1,058 | $18,100 | $0 | $0 |
| 2016 | $931 | $17,100 | $0 | $0 |
| 2015 | $1,473 | $15,700 | $0 | $0 |
| 2013 | $1,460 | $14,700 | $0 | $0 |
| 2012 | $1,469 | $16,900 | $6,100 | $10,800 |
Source: Public Records
Map
Nearby Homes