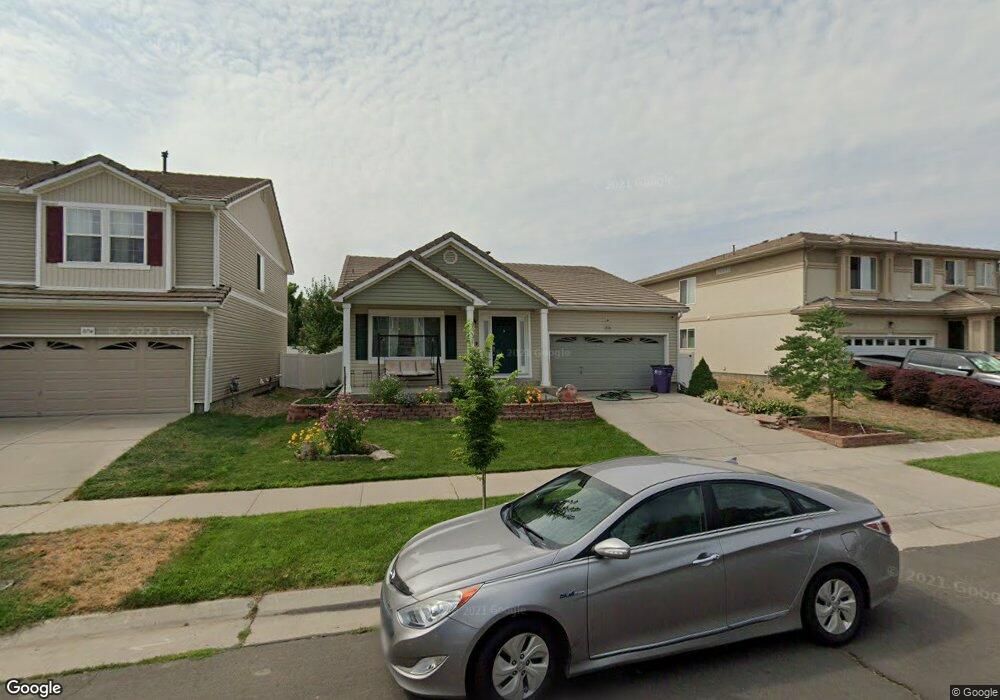
18724 Burlington Place Denver, CO 80249
Green Valley Ranch NeighborhoodEstimated Value: $497,000 - $542,000
2
Beds
3
Baths
1,834
Sq Ft
$286/Sq Ft
Est. Value
About This Home
This home is located at 18724 Burlington Place, Denver, CO 80249 and is currently estimated at $523,663, approximately $285 per square foot. 18724 Burlington Place is a home located in Denver County with nearby schools including Pitt-Waller K-8 School, McGlone Academy, and Marie L. Greenwood Academy.
Ownership History
Date
Name
Owned For
Owner Type
Purchase Details
Closed on
Nov 2, 2017
Sold by
May Gary T
Bought by
Hall Irene G
Current Estimated Value
Home Financials for this Owner
Home Financials are based on the most recent Mortgage that was taken out on this home.
Original Mortgage
$266,500
Outstanding Balance
$223,314
Interest Rate
3.85%
Mortgage Type
New Conventional
Estimated Equity
$300,349
Purchase Details
Closed on
Jan 18, 2017
Sold by
Hall Irene G
Bought by
Hall Irene G and May Gary T
Home Financials for this Owner
Home Financials are based on the most recent Mortgage that was taken out on this home.
Original Mortgage
$245,217
Interest Rate
3.25%
Mortgage Type
FHA
Purchase Details
Closed on
Mar 20, 2006
Sold by
Oakwood Homes Llc
Bought by
Hall Irene G
Home Financials for this Owner
Home Financials are based on the most recent Mortgage that was taken out on this home.
Original Mortgage
$201,320
Interest Rate
6.87%
Mortgage Type
Fannie Mae Freddie Mac
Create a Home Valuation Report for This Property
The Home Valuation Report is an in-depth analysis detailing your home's value as well as a comparison with similar homes in the area
Home Values in the Area
Average Home Value in this Area
Purchase History
| Date | Buyer | Sale Price | Title Company |
|---|---|---|---|
| Hall Irene G | -- | First Integrity Title | |
| Hall Irene G | -- | First Integrity Title | |
| Hall Irene G | $251,700 | Town & Country Title Service |
Source: Public Records
Mortgage History
| Date | Status | Borrower | Loan Amount |
|---|---|---|---|
| Open | Hall Irene G | $266,500 | |
| Previous Owner | Hall Irene G | $245,217 | |
| Previous Owner | Hall Irene G | $201,320 |
Source: Public Records
Tax History Compared to Growth
Tax History
| Year | Tax Paid | Tax Assessment Tax Assessment Total Assessment is a certain percentage of the fair market value that is determined by local assessors to be the total taxable value of land and additions on the property. | Land | Improvement |
|---|---|---|---|---|
| 2024 | $4,474 | $34,970 | $1,790 | $33,180 |
| 2023 | $4,306 | $34,970 | $1,790 | $33,180 |
| 2022 | $4,058 | $30,480 | $4,920 | $25,560 |
| 2021 | $4,058 | $31,360 | $5,060 | $26,300 |
| 2020 | $3,744 | $28,250 | $5,060 | $23,190 |
| 2019 | $3,685 | $28,250 | $5,060 | $23,190 |
| 2018 | $3,378 | $24,950 | $3,140 | $21,810 |
| 2017 | $4,191 | $24,950 | $3,140 | $21,810 |
| 2016 | $3,523 | $21,280 | $3,033 | $18,247 |
| 2015 | $3,450 | $21,280 | $3,033 | $18,247 |
| 2014 | $2,551 | $16,140 | $2,388 | $13,752 |
Source: Public Records
Map
Nearby Homes
- 5188 Andes Way
- 5153 Andes Way
- 18896 E 51st Place
- 18619 E 50th Place
- 5131 Andes St
- 5038 N Andes St
- 5041 N Andes St
- 18703 E 54th Ave
- 18592 E 54th Ave
- 18623 E 54th Ave
- 19060 E 54th Place
- 18236 E 51st Place
- 19118 E 54th Place
- 19158 E 54th Place
- 18295 E 52nd Place
- 19147 E 54th Place
- 5445 Danube St
- 19096 E 55th Ave
- 5033 N Walden Way
- 18211 E 51st Ave
- 18734 Burlington Place
- 18704 Burlington Place
- 18744 Burlington Place
- 18723 E 51st Ave
- 18733 E 51st Ave
- 18703 E 51st Ave
- 18743 E 51st Ave
- 18735 Burlington Place
- 18754 Burlington Place
- 18725 Burlington Place
- 18705 Burlington Place
- 18745 Burlington Place
- 18753 E 51st Ave
- 18764 Burlington Place
- 18674 Burlington Place
- 18680 Burlington Place
- 18670 Burlington Place
- 18763 E 51st Ave
- 18746 E 51st Place
- 18774 Burlington Place