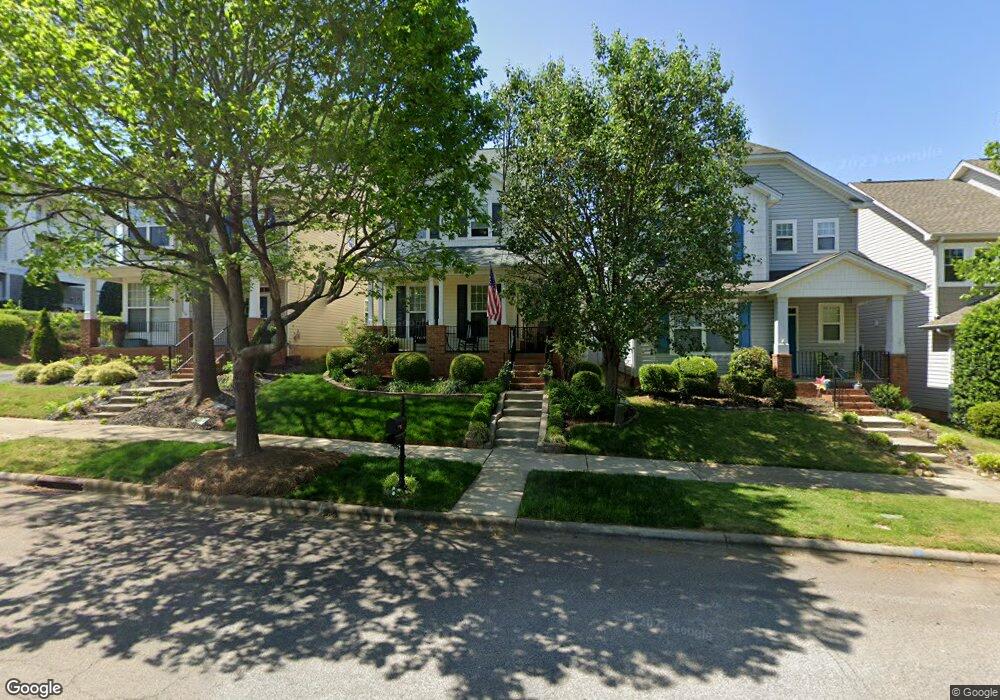
18725 Ruffner Dr Cornelius, NC 28031
Estimated Value: $374,000 - $423,000
3
Beds
3
Baths
1,494
Sq Ft
$268/Sq Ft
Est. Value
About This Home
This home is located at 18725 Ruffner Dr, Cornelius, NC 28031 and is currently estimated at $401,006, approximately $268 per square foot. 18725 Ruffner Dr is a home located in Mecklenburg County with nearby schools including J.V. Washam Elementary School, Bailey Middle School, and William Amos Hough High School.
Ownership History
Date
Name
Owned For
Owner Type
Purchase Details
Closed on
May 8, 2017
Sold by
Gajnt Tyler J
Bought by
Turcotte Jacob D and Turcotte Heather N
Current Estimated Value
Home Financials for this Owner
Home Financials are based on the most recent Mortgage that was taken out on this home.
Original Mortgage
$184,907
Outstanding Balance
$154,318
Interest Rate
4.23%
Mortgage Type
VA
Estimated Equity
$246,688
Purchase Details
Closed on
Dec 29, 2005
Sold by
Payment Aimee E
Bought by
Gant Tyler J
Purchase Details
Closed on
Jun 26, 2002
Sold by
D R Horton Torrey Homes
Bought by
Payment Aimee E
Home Financials for this Owner
Home Financials are based on the most recent Mortgage that was taken out on this home.
Original Mortgage
$147,435
Interest Rate
6.86%
Mortgage Type
FHA
Create a Home Valuation Report for This Property
The Home Valuation Report is an in-depth analysis detailing your home's value as well as a comparison with similar homes in the area
Home Values in the Area
Average Home Value in this Area
Purchase History
| Date | Buyer | Sale Price | Title Company |
|---|---|---|---|
| Turcotte Jacob D | $179,000 | None Available | |
| Gant Tyler J | $160,000 | None Available | |
| Payment Aimee E | $150,000 | -- |
Source: Public Records
Mortgage History
| Date | Status | Borrower | Loan Amount |
|---|---|---|---|
| Open | Turcotte Jacob D | $184,907 | |
| Previous Owner | Payment Aimee E | $147,435 |
Source: Public Records
Tax History
| Year | Tax Paid | Tax Assessment Tax Assessment Total Assessment is a certain percentage of the fair market value that is determined by local assessors to be the total taxable value of land and additions on the property. | Land | Improvement |
|---|---|---|---|---|
| 2025 | $2,474 | $375,500 | $85,000 | $290,500 |
| 2024 | $2,474 | $369,400 | $85,000 | $284,400 |
| 2023 | $2,474 | $369,400 | $85,000 | $284,400 |
| 2022 | $1,993 | $230,100 | $55,000 | $175,100 |
| 2021 | $1,970 | $230,100 | $55,000 | $175,100 |
| 2020 | $1,970 | $230,100 | $55,000 | $175,100 |
| 2019 | $1,964 | $230,100 | $55,000 | $175,100 |
| 2018 | $1,647 | $150,200 | $30,000 | $120,200 |
| 2017 | $1,632 | $150,200 | $30,000 | $120,200 |
| 2016 | $1,629 | $150,200 | $30,000 | $120,200 |
| 2015 | $1,603 | $150,200 | $30,000 | $120,200 |
| 2014 | $1,601 | $0 | $0 | $0 |
Source: Public Records
Map
Nearby Homes
- 9904 Adelie Ct
- 18605 Ruffner Dr Unit 2F
- 9639 Bailey Rd
- 17624 Delmas Dr
- 17610 Delmas Dr
- 19302 Ruffner Dr
- 9516 Westmoreland Rd
- 19149 Celestine Ln
- 10504 Audubon Ridge Dr
- 10416 Audubon Ridge Dr
- 11635 Truan Ln
- 10205 Treetop Ln
- 9232 Ducati Ln
- 19436 Coachmans Trace
- 9216 Ducati Ln
- 19700 Coachmans Trace
- 10324 Bon Meade Ln Unit 124A
- 20110 Coachmans Wood Ln
- 10205 Danesway Ln
- 21014 Pine Ridge Dr
- 18729 Ruffner Dr
- 18721 Ruffner Dr
- 18733 Ruffner Dr
- 18737 Ruffner Dr
- 18720 Ronceverte Dr
- 18724 Ronceverte Dr
- 18716 Ronceverte Dr
- 18728 Ronceverte Dr
- 18712 Ronceverte Dr
- 18732 Ronceverte Dr
- 18708 Ronceverte Dr
- 18708 Ronceverte Dr Unit 210
- 18704 Ronceverte Dr
- 18711 Ruffner Dr
- 18711 Ruffner Dr Unit 18711 Ruffner Dr.
- 18711 Ruffner Dr Unit 3H
- 18711 Ruffner Dr Unit 3G
- 18711 Ruffner Dr Unit 3F
- 18711 Ruffner Dr Unit 3E
- 18711 Ruffner Dr Unit 3D
Your Personal Tour Guide
Ask me questions while you tour the home.