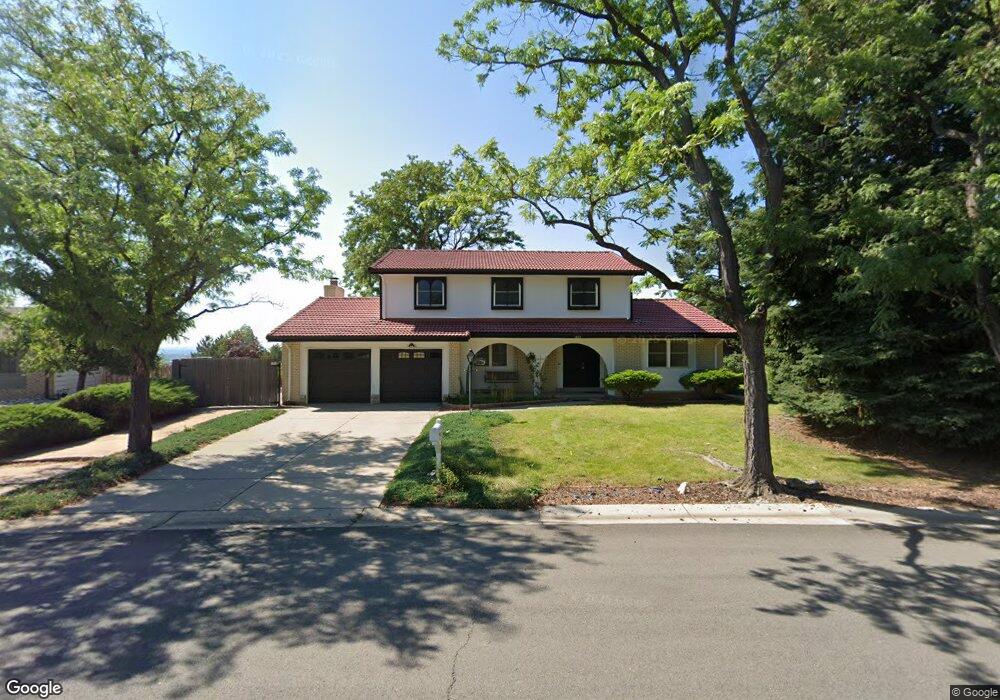
1873 S Robb St Denver, CO 80232
Green Mountain NeighborhoodEstimated Value: $650,000 - $716,000
6
Beds
4
Baths
3,150
Sq Ft
$218/Sq Ft
Est. Value
About This Home
This home is located at 1873 S Robb St, Denver, CO 80232 and is currently estimated at $686,618, approximately $217 per square foot. 1873 S Robb St is a home located in Jefferson County with nearby schools including Kendrick Lakes Elementary School, Carmody Middle School, and Bear Creek High School.
Ownership History
Date
Name
Owned For
Owner Type
Purchase Details
Closed on
Nov 30, 2022
Sold by
Lee Lizbeth L
Bought by
Lee David Gant
Current Estimated Value
Home Financials for this Owner
Home Financials are based on the most recent Mortgage that was taken out on this home.
Original Mortgage
$462,750
Outstanding Balance
$448,864
Interest Rate
6.95%
Mortgage Type
New Conventional
Estimated Equity
$237,754
Purchase Details
Closed on
Oct 4, 2022
Sold by
Janzer Family Trust
Bought by
Lee Lizbeth L
Home Financials for this Owner
Home Financials are based on the most recent Mortgage that was taken out on this home.
Original Mortgage
$462,750
Outstanding Balance
$448,864
Interest Rate
6.95%
Mortgage Type
New Conventional
Estimated Equity
$237,754
Purchase Details
Closed on
Oct 8, 1997
Sold by
Janzer Victor J and Janzer Marie M
Bought by
The Janzer Family Trust
Purchase Details
Closed on
Apr 4, 1997
Sold by
Janzer Victor J and Janzer Marie M
Bought by
The Janzer Family Trust
Create a Home Valuation Report for This Property
The Home Valuation Report is an in-depth analysis detailing your home's value as well as a comparison with similar homes in the area
Home Values in the Area
Average Home Value in this Area
Purchase History
| Date | Buyer | Sale Price | Title Company |
|---|---|---|---|
| Lee David Gant | $617,000 | -- | |
| Lee Lizbeth L | $617,000 | -- | |
| The Janzer Family Trust | -- | -- | |
| The Janzer Family Trust | -- | -- |
Source: Public Records
Mortgage History
| Date | Status | Borrower | Loan Amount |
|---|---|---|---|
| Open | Lee David Gant | $462,750 |
Source: Public Records
Tax History Compared to Growth
Tax History
| Year | Tax Paid | Tax Assessment Tax Assessment Total Assessment is a certain percentage of the fair market value that is determined by local assessors to be the total taxable value of land and additions on the property. | Land | Improvement |
|---|---|---|---|---|
| 2024 | $3,582 | $36,180 | $15,050 | $21,130 |
| 2023 | $3,582 | $36,180 | $15,050 | $21,130 |
| 2022 | $2,396 | $30,675 | $10,483 | $20,192 |
| 2021 | $2,426 | $31,558 | $10,785 | $20,773 |
| 2020 | $2,095 | $28,251 | $9,107 | $19,144 |
| 2019 | $2,069 | $28,251 | $9,107 | $19,144 |
| 2018 | $1,915 | $26,040 | $6,815 | $19,225 |
| 2017 | $1,750 | $26,040 | $6,815 | $19,225 |
| 2016 | $1,644 | $25,016 | $6,979 | $18,037 |
| 2015 | $1,494 | $25,016 | $6,979 | $18,037 |
| 2014 | $1,494 | $22,488 | $5,692 | $16,796 |
Source: Public Records
Map
Nearby Homes
- 1822 S Robb St
- 1865 S Union Blvd
- 1847 S Union Blvd Unit 36
- 11165 W Asbury Ave
- 1901 S Union Place
- 1799 S Van Gordon Ct
- 1577 S Pierson St
- 2154 S Parfet Dr
- 2064 S Robb Way
- 2252 S Queen St
- 10866 W Evans Ave Unit 56
- 1537 S Owens St Unit 31
- 10890 W Evans Ave Unit 2E
- 1454 S Urban Way
- 1474 S Pierson St Unit 65
- 1517 S Owens St Unit 5
- 10490 W Jewell Ave Unit C
- 10490 W Jewell Ave Unit D
- 10910 W Florida Ave Unit 502
- 10430 W Jewell Ave Unit B
- 1874 S Queen Way
- 1863 S Robb St
- 1862 S Robb St
- 1864 S Queen Way
- 1853 S Robb St
- 1914 S Queen Dr
- 1845 S Queen Way
- 1916 S Queen Dr
- 1842 S Robb St
- 1843 S Robb St
- 1920 S Queen Dr
- 1912 S Queen Dr
- 1825 S Queen Way
- 1854 S Queen Way
- 1832 S Robb St
- 1922 S Queen Dr
- 1833 S Robb St
- 11968 W Jewell Ave
- 1815 S Queen Way
- 1926 S Queen Dr