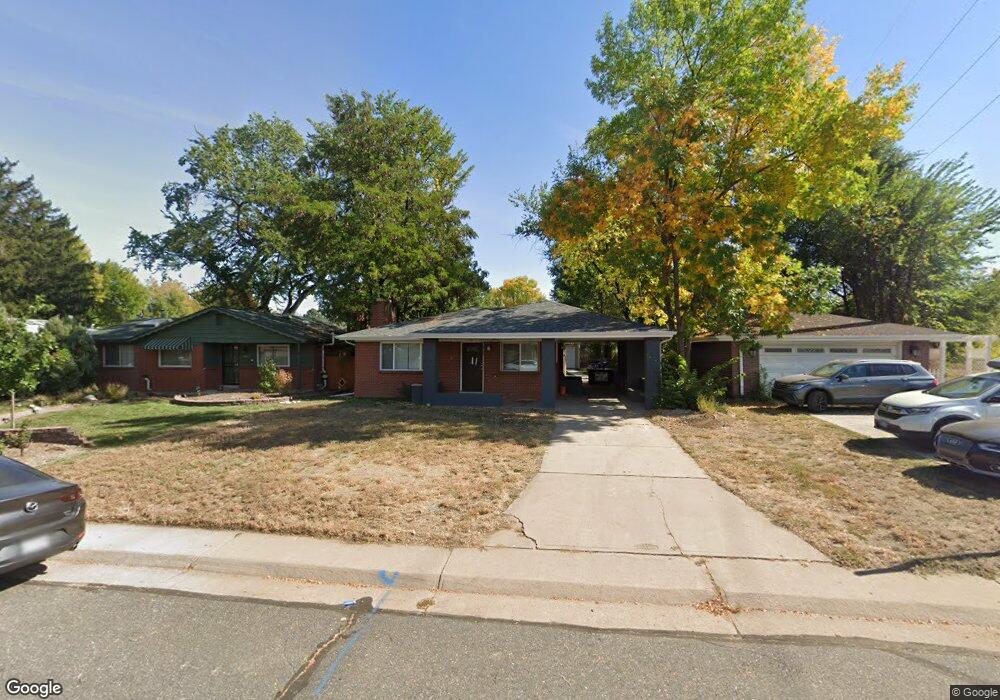
1874 S Clayton St Denver, CO 80210
University Park NeighborhoodEstimated Value: $629,000 - $841,856
3
Beds
3
Baths
1,371
Sq Ft
$561/Sq Ft
Est. Value
About This Home
This home is located at 1874 S Clayton St, Denver, CO 80210 and is currently estimated at $769,464, approximately $561 per square foot. 1874 S Clayton St is a home located in Denver County with nearby schools including University Park Elementary School, Merrill Middle School, and South High School.
Ownership History
Date
Name
Owned For
Owner Type
Purchase Details
Closed on
Nov 20, 2024
Sold by
Greater Den Investments Llc
Bought by
Williams Alfred H
Current Estimated Value
Purchase Details
Closed on
Jun 8, 2021
Sold by
Fairbairn Lindsey A and Fairbairn John Rd
Bought by
Greater Den Investments Llc
Purchase Details
Closed on
Jul 31, 1996
Sold by
Gill John Glenn and Tilstra Randy
Bought by
Fairbairn John R D and Fairbairn Lindsey A
Home Financials for this Owner
Home Financials are based on the most recent Mortgage that was taken out on this home.
Original Mortgage
$121,200
Interest Rate
8.33%
Purchase Details
Closed on
Dec 15, 1994
Sold by
Reynolds Joseph Michael and Reynolds Katherine Mae
Bought by
Gill John Glenn and Tilstra Randy
Create a Home Valuation Report for This Property
The Home Valuation Report is an in-depth analysis detailing your home's value as well as a comparison with similar homes in the area
Home Values in the Area
Average Home Value in this Area
Purchase History
| Date | Buyer | Sale Price | Title Company |
|---|---|---|---|
| Williams Alfred H | -- | None Listed On Document | |
| Williams Alfred H | -- | None Listed On Document | |
| Greater Den Investments Llc | $550,000 | Ascendant Title Company | |
| Fairbairn John R D | $151,500 | Heritage Title | |
| Gill John Glenn | $133,000 | First American Heritage Titl |
Source: Public Records
Mortgage History
| Date | Status | Borrower | Loan Amount |
|---|---|---|---|
| Previous Owner | Fairbairn John R D | $121,200 |
Source: Public Records
Tax History Compared to Growth
Tax History
| Year | Tax Paid | Tax Assessment Tax Assessment Total Assessment is a certain percentage of the fair market value that is determined by local assessors to be the total taxable value of land and additions on the property. | Land | Improvement |
|---|---|---|---|---|
| 2024 | $3,822 | $48,260 | $34,590 | $13,670 |
| 2023 | $3,739 | $48,260 | $34,590 | $13,670 |
| 2022 | $3,278 | $41,220 | $27,290 | $13,930 |
| 2021 | $3,165 | $42,420 | $28,080 | $14,340 |
| 2020 | $3,181 | $42,880 | $24,250 | $18,630 |
| 2019 | $3,092 | $42,880 | $24,250 | $18,630 |
| 2018 | $2,996 | $38,730 | $21,850 | $16,880 |
| 2017 | $2,987 | $38,730 | $21,850 | $16,880 |
| 2016 | $2,470 | $30,290 | $18,475 | $11,815 |
| 2015 | $2,366 | $30,290 | $18,475 | $11,815 |
| 2014 | $2,253 | $27,130 | $19,892 | $7,238 |
Source: Public Records
Map
Nearby Homes
- 1875 S Clayton St
- 1907 S Columbine St
- 1925 S Columbine St
- 1950 S Milwaukee St
- 2067 S Clayton St
- 2077 S Clayton St
- 1840 S Steele St
- 1665 S Fillmore St
- 1904 S Adams St
- 1880 S Adams St
- 1624 S Elizabeth St
- 1625 S Fillmore St
- 2131 S Columbine St
- 1790 S Adams St
- 1675 S Steele St
- 2225 Buchtel Blvd Unit 1011
- 2225 Buchtel Blvd Unit 703
- 2225 Buchtel Blvd Unit 1007
- 2225 Buchtel Blvd Unit 506
- 2225 Buchtel Blvd Unit 105
- 1866 S Clayton St
- 1880 S Clayton St
- 1860 S Clayton St
- 1850 S Clayton St
- 1871 S Fillmore St
- 1881 S Fillmore St
- 1861 S Fillmore St
- 1891 S Fillmore St
- 1840 S Clayton St
- 1851 S Fillmore St
- 1885 S Clayton St
- 1841 S Fillmore St
- 1834 S Clayton St
- 1869 S Clayton St
- 1831 S Fillmore St
- 1843 S Clayton St
- 1824 S Clayton St
- 1839 S Clayton St
- 1825 S Fillmore St
- 1900 S Clayton St