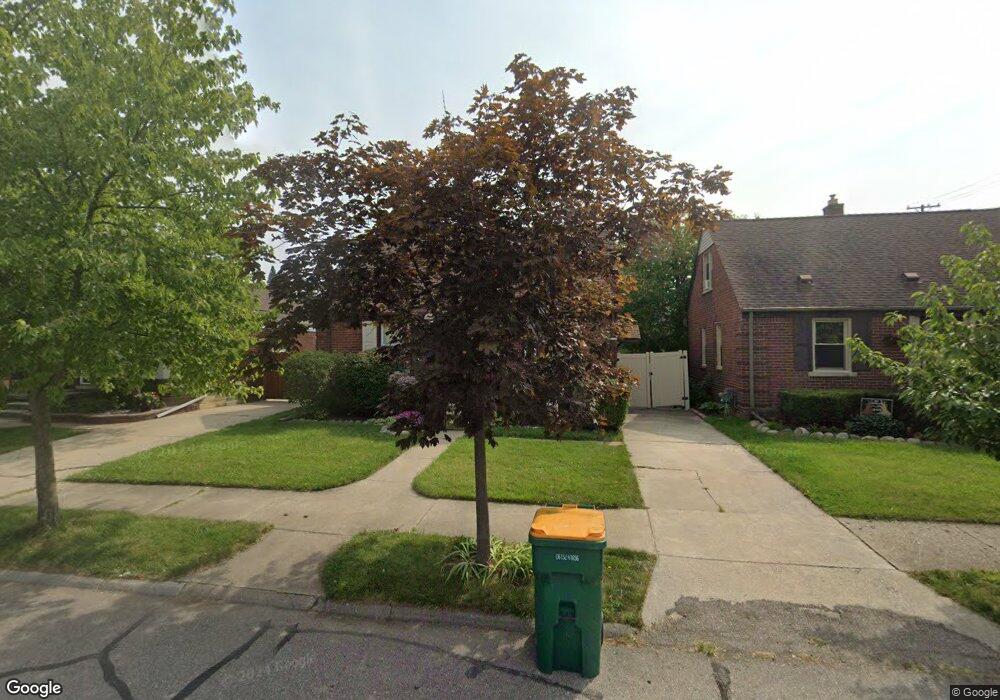
1875 18th St Unit Bldg-Unit Wyandotte, MI 48192
Estimated Value: $188,404 - $227,000
--
Bed
2
Baths
938
Sq Ft
$221/Sq Ft
Est. Value
About This Home
This home is located at 1875 18th St Unit Bldg-Unit, Wyandotte, MI 48192 and is currently estimated at $207,351, approximately $221 per square foot. 1875 18th St Unit Bldg-Unit is a home located in Wayne County with nearby schools including Jefferson Elementary School, Woodrow Wilson School, and Roosevelt High School.
Ownership History
Date
Name
Owned For
Owner Type
Purchase Details
Closed on
Aug 1, 2018
Sold by
Teets Ryan S
Bought by
Miller Cody M
Current Estimated Value
Home Financials for this Owner
Home Financials are based on the most recent Mortgage that was taken out on this home.
Original Mortgage
$135,315
Outstanding Balance
$117,516
Interest Rate
4.5%
Mortgage Type
New Conventional
Estimated Equity
$89,835
Purchase Details
Closed on
Nov 30, 2007
Sold by
Hutson Lori Ann and Hutson Lori A
Bought by
Teets Ryan S
Create a Home Valuation Report for This Property
The Home Valuation Report is an in-depth analysis detailing your home's value as well as a comparison with similar homes in the area
Home Values in the Area
Average Home Value in this Area
Purchase History
| Date | Buyer | Sale Price | Title Company |
|---|---|---|---|
| Miller Cody M | $139,500 | None Available | |
| Teets Ryan S | $120,500 | Minnesota Title Agency |
Source: Public Records
Mortgage History
| Date | Status | Borrower | Loan Amount |
|---|---|---|---|
| Open | Miller Cody M | $135,315 |
Source: Public Records
Tax History Compared to Growth
Tax History
| Year | Tax Paid | Tax Assessment Tax Assessment Total Assessment is a certain percentage of the fair market value that is determined by local assessors to be the total taxable value of land and additions on the property. | Land | Improvement |
|---|---|---|---|---|
| 2025 | $2,413 | $76,900 | $0 | $0 |
| 2024 | $2,413 | $72,300 | $0 | $0 |
| 2023 | $2,301 | $65,700 | $0 | $0 |
| 2022 | $2,665 | $57,100 | $0 | $0 |
| 2021 | $2,612 | $55,000 | $0 | $0 |
| 2020 | $2,576 | $50,200 | $0 | $0 |
| 2019 | $2,540 | $46,300 | $0 | $0 |
| 2018 | $1,473 | $39,900 | $0 | $0 |
| 2017 | $645 | $39,900 | $0 | $0 |
| 2016 | $1,782 | $36,300 | $0 | $0 |
| 2015 | $3,179 | $33,700 | $0 | $0 |
| 2013 | $3,080 | $30,800 | $0 | $0 |
| 2012 | $1,470 | $32,200 | $7,500 | $24,700 |
Source: Public Records
Map
Nearby Homes