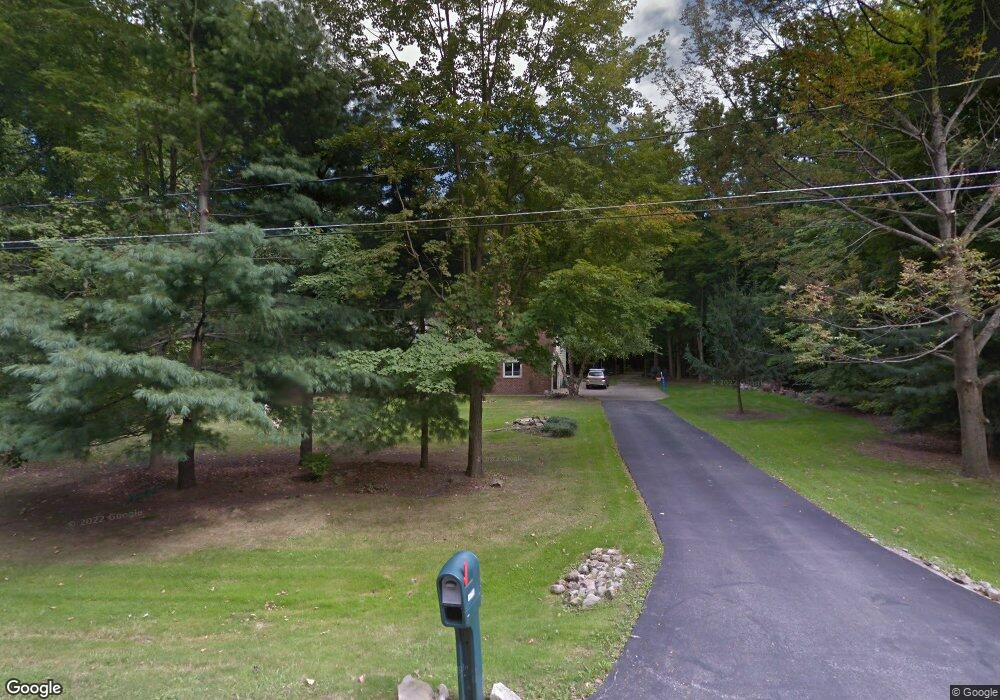
18753 Highpoint Rd Bainbridge, OH 44023
Estimated Value: $470,000 - $525,000
5
Beds
4
Baths
2,534
Sq Ft
$199/Sq Ft
Est. Value
About This Home
This home is located at 18753 Highpoint Rd, Bainbridge, OH 44023 and is currently estimated at $504,689, approximately $199 per square foot. 18753 Highpoint Rd is a home located in Geauga County with nearby schools including Timmons Elementary School, Kenston Intermediate School, and Kenston Middle School.
Ownership History
Date
Name
Owned For
Owner Type
Purchase Details
Closed on
Jun 7, 2013
Sold by
Zawitz Julie L
Bought by
Richardson Stephen J and Richardson Elizabeth J
Current Estimated Value
Home Financials for this Owner
Home Financials are based on the most recent Mortgage that was taken out on this home.
Original Mortgage
$222,660
Outstanding Balance
$157,609
Interest Rate
3.38%
Mortgage Type
New Conventional
Estimated Equity
$347,080
Purchase Details
Closed on
Aug 28, 2000
Sold by
Sobocinski Vincent E and Sobocinski Dawn M
Bought by
Zawitz Julie L
Purchase Details
Closed on
Aug 14, 1996
Sold by
Cairns James A
Bought by
Sobocinski Vincent E and Sobocinski Dawn M
Home Financials for this Owner
Home Financials are based on the most recent Mortgage that was taken out on this home.
Original Mortgage
$131,500
Interest Rate
8.18%
Mortgage Type
New Conventional
Purchase Details
Closed on
Aug 29, 1991
Bought by
Cairns James A
Create a Home Valuation Report for This Property
The Home Valuation Report is an in-depth analysis detailing your home's value as well as a comparison with similar homes in the area
Home Values in the Area
Average Home Value in this Area
Purchase History
| Date | Buyer | Sale Price | Title Company |
|---|---|---|---|
| Richardson Stephen J | $247,400 | None Available | |
| Zawitz Julie L | $234,900 | Rockwell Title Agency Inc | |
| Sobocinski Vincent E | $191,000 | -- | |
| Cairns James A | $185,000 | -- |
Source: Public Records
Mortgage History
| Date | Status | Borrower | Loan Amount |
|---|---|---|---|
| Open | Richardson Stephen J | $222,660 | |
| Previous Owner | Sobocinski Vincent E | $131,500 |
Source: Public Records
Tax History Compared to Growth
Tax History
| Year | Tax Paid | Tax Assessment Tax Assessment Total Assessment is a certain percentage of the fair market value that is determined by local assessors to be the total taxable value of land and additions on the property. | Land | Improvement |
|---|---|---|---|---|
| 2024 | $6,612 | $123,550 | $24,220 | $99,330 |
| 2023 | $6,612 | $123,550 | $24,220 | $99,330 |
| 2022 | $5,846 | $95,450 | $20,270 | $75,180 |
| 2021 | $5,865 | $95,450 | $20,270 | $75,180 |
| 2020 | $6,025 | $95,450 | $20,270 | $75,180 |
| 2019 | $5,792 | $84,530 | $20,270 | $64,260 |
| 2018 | $5,790 | $84,530 | $20,270 | $64,260 |
| 2017 | $5,792 | $84,530 | $20,270 | $64,260 |
| 2016 | $5,618 | $80,370 | $20,270 | $60,100 |
| 2015 | $5,464 | $80,370 | $20,270 | $60,100 |
| 2014 | $4,993 | $80,370 | $20,270 | $60,100 |
| 2013 | $5,031 | $80,370 | $20,270 | $60,100 |
Source: Public Records
Map
Nearby Homes
- 18764 Chillicothe Rd
- 18832 Maplewood Ln
- 19075 Ridgeview Trail
- 18367 Cranberry Ridge Ln
- 7915 Bainbrook Dr
- 8699 Chase Dr
- Lyon Plan at Renaissance Park at Geauga Lake - Ranch Homes
- 835 Dipper Ln
- 850 Dipper Ln
- 805 Dipper Ln Unit 2
- 855 Dipper Ln
- 870 Dipper Ln Unit 2
- 950 Memory Ln
- 970-2 Memory Ln
- 965-1 Memory Ln
- 960-1 Memory Ln
- 960-2 Memory Ln
- 7981 Scotland Dr
- 18064 Kenston Lake Dr
- 818 Hilliary Ln
- 18753 High Point Rd
- 18731 High Point Rd
- 18765 High Point Rd
- 18705 High Point Rd
- 18732 High Point Rd
- 18762 High Point Rd
- 18787 High Point Rd
- 18700 High Point Rd
- 18746 High Point Rd
- 18778 High Point Rd
- 8189 Pettibone Rd
- 8199 Pettibone Rd
- 18801 High Point Rd
- 18790 High Point Rd
- 8201 Pettibone Rd
- 8249 Pettibone Rd
- 8137 Pettibone Rd
- 18823 High Point Rd
- 8223 Pettibone Rd
- 18812 High Point Rd