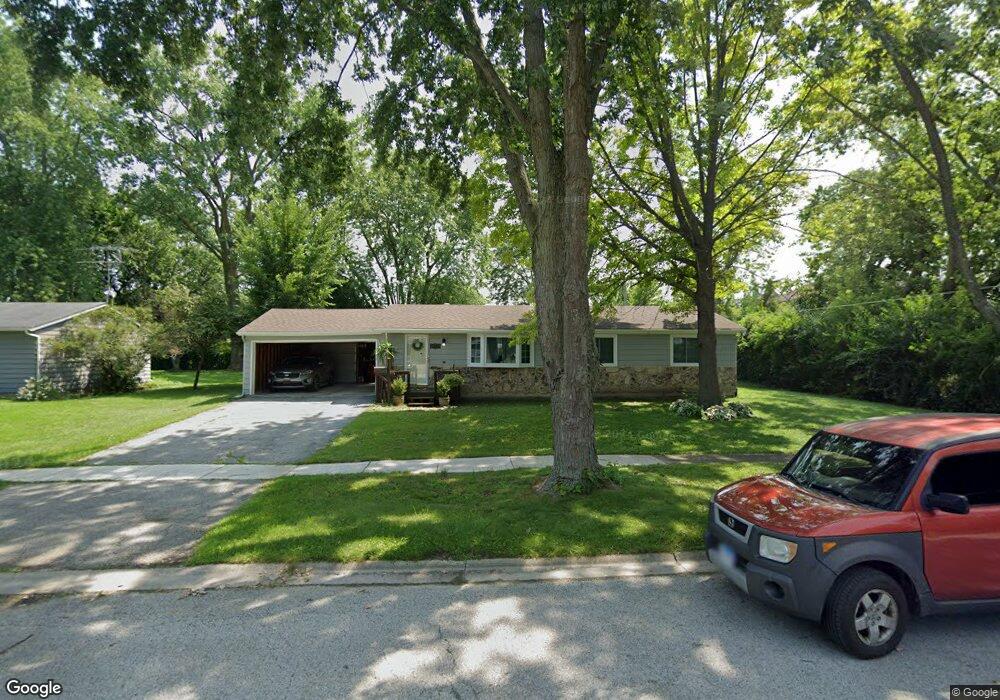
18759 W Highfield Dr Gurnee, IL 60031
Estimated Value: $308,000 - $434,000
3
Beds
2
Baths
1,472
Sq Ft
$244/Sq Ft
Est. Value
About This Home
This home is located at 18759 W Highfield Dr, Gurnee, IL 60031 and is currently estimated at $359,027, approximately $243 per square foot. 18759 W Highfield Dr is a home located in Lake County with nearby schools including Woodland Primary School, Woodland Intermediate School, and Woodland Elementary School.
Ownership History
Date
Name
Owned For
Owner Type
Purchase Details
Closed on
Nov 25, 2009
Sold by
Walker Douglas and Walker Angelique
Bought by
Lawson Lawrence C and Lawson Ana
Current Estimated Value
Home Financials for this Owner
Home Financials are based on the most recent Mortgage that was taken out on this home.
Original Mortgage
$180,170
Outstanding Balance
$118,956
Interest Rate
5.14%
Mortgage Type
FHA
Estimated Equity
$240,071
Purchase Details
Closed on
Dec 2, 2002
Sold by
Clark Douglas S and David S Clark Declaration Of T
Bought by
Walker Douglas and Walker Angelique J
Home Financials for this Owner
Home Financials are based on the most recent Mortgage that was taken out on this home.
Original Mortgage
$110,000
Interest Rate
6.3%
Purchase Details
Closed on
Sep 22, 2000
Sold by
Clark David S
Bought by
Clark David S and David S Clark Declaration Of T
Purchase Details
Closed on
Oct 3, 1994
Sold by
Jackowski James E
Bought by
Clark David S
Create a Home Valuation Report for This Property
The Home Valuation Report is an in-depth analysis detailing your home's value as well as a comparison with similar homes in the area
Home Values in the Area
Average Home Value in this Area
Purchase History
| Date | Buyer | Sale Price | Title Company |
|---|---|---|---|
| Lawson Lawrence C | $188,500 | First American Title | |
| Walker Douglas | $175,000 | -- | |
| Clark David S | -- | -- | |
| Clark David S | $135,000 | First American Title |
Source: Public Records
Mortgage History
| Date | Status | Borrower | Loan Amount |
|---|---|---|---|
| Open | Lawson Lawrence C | $180,170 | |
| Previous Owner | Walker Douglas | $110,000 |
Source: Public Records
Tax History Compared to Growth
Tax History
| Year | Tax Paid | Tax Assessment Tax Assessment Total Assessment is a certain percentage of the fair market value that is determined by local assessors to be the total taxable value of land and additions on the property. | Land | Improvement |
|---|---|---|---|---|
| 2024 | $10,231 | $119,816 | $13,876 | $105,940 |
| 2023 | $8,429 | $108,000 | $12,508 | $95,492 |
| 2022 | $8,429 | $84,292 | $13,011 | $71,281 |
| 2021 | $7,448 | $78,653 | $12,009 | $66,644 |
| 2020 | $7,175 | $76,720 | $11,714 | $65,006 |
| 2019 | $7,035 | $74,493 | $11,374 | $63,119 |
| 2018 | $6,272 | $69,544 | $15,578 | $53,966 |
| 2017 | $6,276 | $67,552 | $15,132 | $52,420 |
| 2016 | $6,234 | $63,537 | $14,458 | $49,079 |
| 2015 | $6,030 | $60,259 | $13,712 | $46,547 |
| 2014 | $5,232 | $54,636 | $14,357 | $40,279 |
| 2012 | $5,259 | $55,054 | $14,467 | $40,587 |
Source: Public Records
Map
Nearby Homes
- 18758 W Highfield Dr
- 18705 W Ash Dr
- 36688 N Yew Tree Dr
- 18595 W Judy Dr
- 36225 N Us Highway 45
- 36873 N Deer Trail Dr
- 36712 N Traer Terrace
- 18325 W Lakeview Terrace
- 18229 W Banbury Dr
- 19151 W Grand Ave
- 19414 W Grand Ave
- Abbeyville Plan at Briargate
- Ascend with Basement Plan at Briargate
- Abbeyville with Basement Plan at Briargate
- Martin Ray with Basement Plan at Briargate
- Ascend Plan at Briargate
- Passport Plan at Briargate
- Martin Ray Plan at Briargate
- 2895 Briargate Dr
- 1593 Vineyard Dr
- 18743 W Highfield Dr
- 18706 W Westwood Place
- 18747 W Highfield Dr
- 18694 W Westwood Place
- 18680 W Westwood Place
- 18674 W Westwood Place Unit 3
- 36426 N Beverly Ave
- 36345 N Yew Tree Dr
- 36359 N Yew Tree Dr
- 18711 W Highfield Dr
- 18666 W Highfield Dr
- 36374 N Yew Tree Dr
- 36388 N Yew Tree Dr
- 36360 N Yew Tree Dr
- 36444 N Beverly Ave
- 36402 N Yew Tree Dr
- 36311 N Yew Tree Dr
- 36344 N Yew Tree Dr
- 18705 W Westwood Place
- 36427 N Beverly Ave