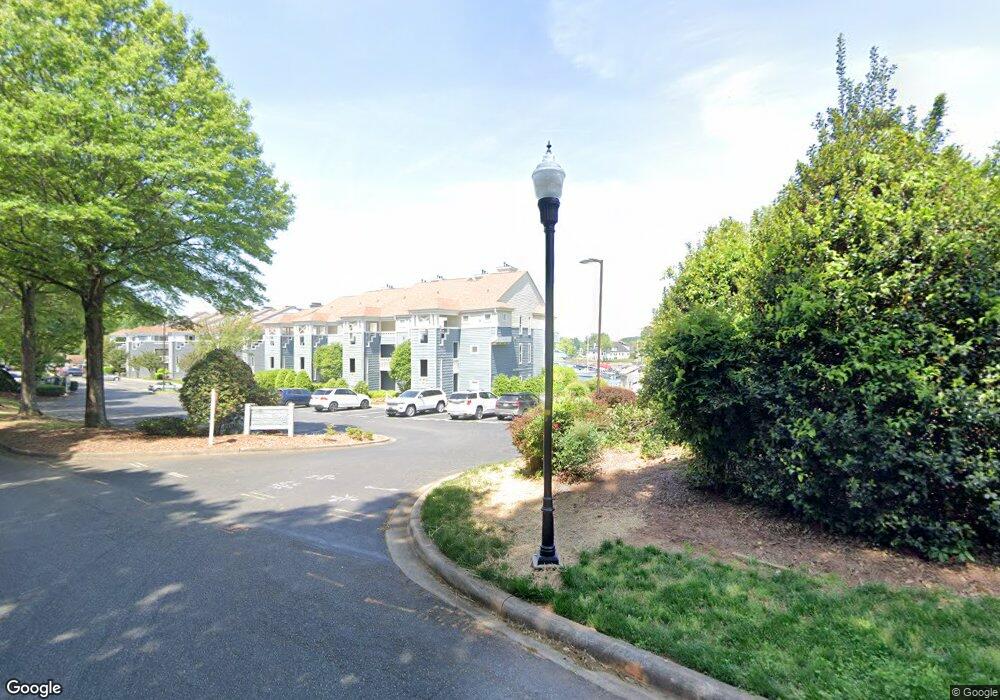
18761 Vineyard Point Ln Unit 18761 Cornelius, NC 28031
Estimated Value: $408,000 - $471,000
2
Beds
2
Baths
1,008
Sq Ft
$434/Sq Ft
Est. Value
About This Home
This home is located at 18761 Vineyard Point Ln Unit 18761, Cornelius, NC 28031 and is currently estimated at $437,476, approximately $434 per square foot. 18761 Vineyard Point Ln Unit 18761 is a home located in Mecklenburg County with nearby schools including J.V. Washam Elementary School, Bailey Middle School, and William Amos Hough High School.
Ownership History
Date
Name
Owned For
Owner Type
Purchase Details
Closed on
Jul 18, 2016
Sold by
Elmer David and Elmer Christine
Bought by
Clarkin Stephen G and Clarkin Cynthia
Current Estimated Value
Home Financials for this Owner
Home Financials are based on the most recent Mortgage that was taken out on this home.
Original Mortgage
$164,000
Outstanding Balance
$74,433
Interest Rate
3.6%
Mortgage Type
New Conventional
Estimated Equity
$363,043
Purchase Details
Closed on
Mar 31, 2006
Sold by
Dalton Robert R and Dalton Deborah
Bought by
Elmer David and Elmer Christine
Home Financials for this Owner
Home Financials are based on the most recent Mortgage that was taken out on this home.
Original Mortgage
$149,600
Interest Rate
6.87%
Mortgage Type
Fannie Mae Freddie Mac
Create a Home Valuation Report for This Property
The Home Valuation Report is an in-depth analysis detailing your home's value as well as a comparison with similar homes in the area
Home Values in the Area
Average Home Value in this Area
Purchase History
| Date | Buyer | Sale Price | Title Company |
|---|---|---|---|
| Clarkin Stephen G | $205,000 | None Available | |
| Elmer David | $187,000 | None Available |
Source: Public Records
Mortgage History
| Date | Status | Borrower | Loan Amount |
|---|---|---|---|
| Open | Clarkin Stephen G | $164,000 | |
| Previous Owner | Elmer David | $149,600 |
Source: Public Records
Tax History Compared to Growth
Tax History
| Year | Tax Paid | Tax Assessment Tax Assessment Total Assessment is a certain percentage of the fair market value that is determined by local assessors to be the total taxable value of land and additions on the property. | Land | Improvement |
|---|---|---|---|---|
| 2025 | -- | $401,830 | -- | $401,830 |
| 2024 | -- | $401,830 | -- | $401,830 |
| 2023 | $1,918 | $448,400 | $0 | $448,400 |
| 2022 | $1,918 | $221,300 | $0 | $221,300 |
| 2021 | $1,896 | $221,300 | $0 | $221,300 |
| 2020 | $1,896 | $221,300 | $0 | $221,300 |
| 2019 | $1,890 | $221,300 | $0 | $221,300 |
| 2018 | $2,092 | $191,500 | $75,000 | $116,500 |
| 2017 | $2,074 | $191,500 | $75,000 | $116,500 |
| 2016 | $2,071 | $191,500 | $75,000 | $116,500 |
| 2015 | $2,039 | $191,500 | $75,000 | $116,500 |
| 2014 | $2,037 | $214,800 | $80,000 | $134,800 |
Source: Public Records
Map
Nearby Homes
- 18679 Vineyard Point Ln Unit 56
- 18867 Vineyard Point Ln Unit 34
- 17431 Tuscany Ln
- 18647 Vineyard Point Ln Unit 1
- 17509 Tuscany Ln Unit 17
- 18589 Vineyard Point Ln Unit 33
- 17557 Tuscany Ln
- 8233 Houser St
- 17709 Sedona Way
- 17810 Half Moon Ln Unit L
- 17811 Half Moon Ln Unit E
- 17925 Kings Point Dr Unit F
- 17919 Kings Point Dr
- 17931 Kings Point Dr Unit G
- 18009 Kings Point Dr Unit I
- 15905 Robbins Green Dr
- 17005 Carlton Way Rd
- 18840 Nautical Dr Unit 65
- 7423 Norman Island Dr
- 8350 Brickle Ln
- 18729 Vineyard Point Ln
- 18733 Vineyard Point Ln Unit 31
- 18745 Vineyard Point Ln Unit 25
- 18759 Vineyard Point Ln Unit 20
- 18731 Vineyard Point Ln Unit 36
- 18735 Vineyard Point Ln
- 18743 Vineyard Point Ln
- 18761 Vineyard Point Ln Unit 21
- 18757 Vineyard Point Ln Unit 19
- 18739 Vineyard Point Ln Unit 28
- 18727 Vineyard Point Ln Unit 34
- 18753 Vineyard Point Ln Unit 23
- 18717 Vineyard Point Ln
- 18717 Vineyard Point Ln
- 18747 Vineyard Point Ln
- 18747 Vineyard Point Ln Unit 747
- 18719 Vineyard Point Ln
- 18721 Vineyard Point Ln
- 18749 Vineyard Point Ln Unit 27
- 18755 Vineyard Point Ln Unit 24 Bldg 2