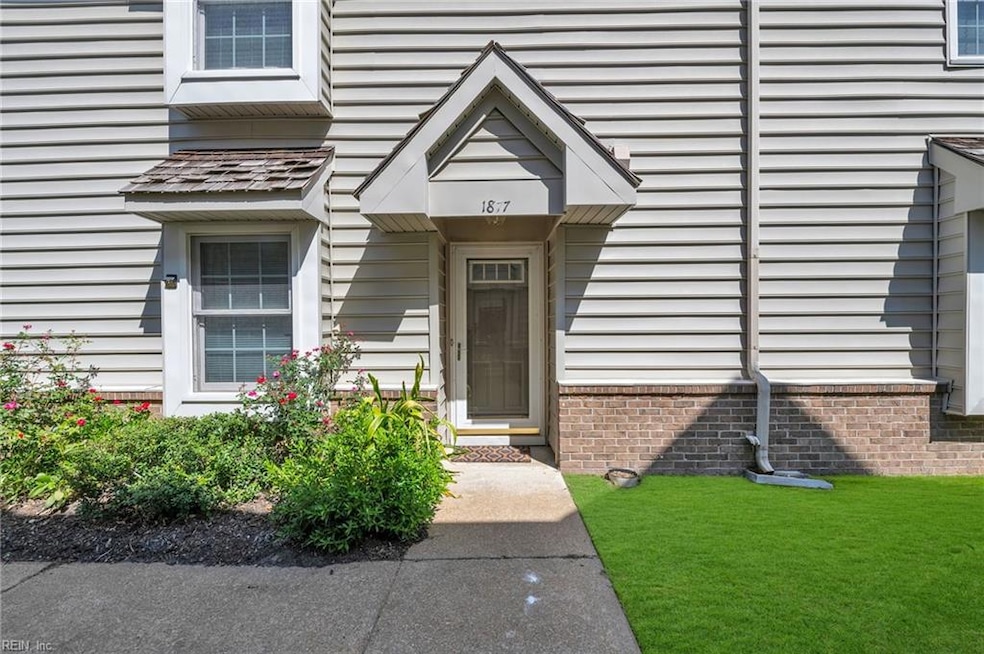
1877 Calash Way Virginia Beach, VA 23454
Great Neck NeighborhoodEstimated payment $2,063/month
Highlights
- Community Pool
- En-Suite Primary Bedroom
- Ceiling Fan
- Alanton Elementary School Rated A
- Ceramic Tile Flooring
- Door to Door Trash Pickup
About This Home
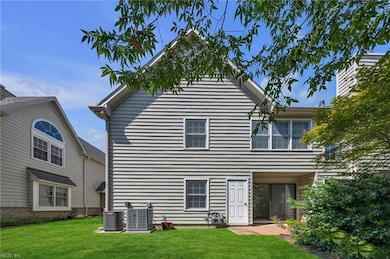
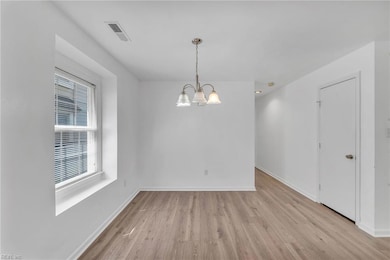
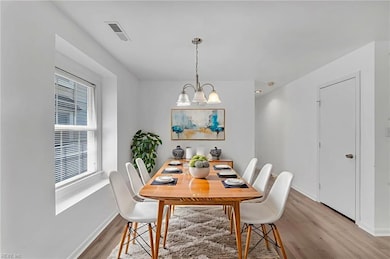
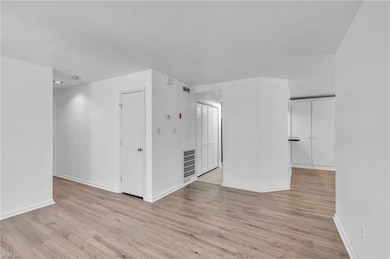
Check out this lovely 1-story, 1st floor condo in Great Neck Villas! Located just a few minutes from all major attractions Virginia Beach has to offer, and just a few blocks away from many great restaurants, grocery and shopping options. The condo fee includes water, sewer, trash pick-up, exterior and grounds maintenance, and a very nice pool!
Property Details
Home Type
- Multi-Family
Est. Annual Taxes
- $2,634
Year Built
- Built in 1991
HOA Fees
- $395 Monthly HOA Fees
Home Design
- Property Attached
- Slab Foundation
- Asphalt Shingled Roof
- Vinyl Siding
Interior Spaces
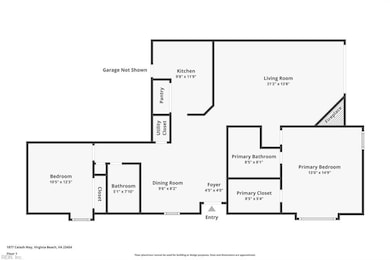
- 1,239 Sq Ft Home
- 1-Story Property
- Ceiling Fan
- Gas Fireplace
Kitchen
- Microwave
- Dishwasher
- Disposal
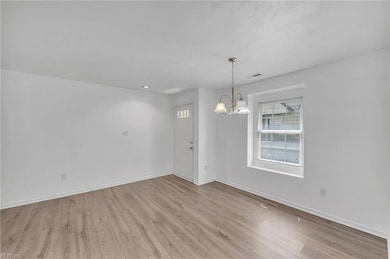
Flooring
- Laminate
- Ceramic Tile
Bedrooms and Bathrooms
- 2 Bedrooms
- En-Suite Primary Bedroom
- 2 Full Bathrooms
Laundry
- Dryer
- Washer
Parking
- 2 Car Parking Spaces
- Driveway
Schools
- Alanton Elementary School
- Lynnhaven Middle School
- First Colonial High School
Utilities
- Heat Pump System
- Electric Water Heater
- Sewer Paid
Community Details
Overview
- Associa Community Group 757 499 2200 Association
- Low-Rise Condominium
- Great Neck Villas Subdivision
- On-Site Maintenance
Amenities
- Door to Door Trash Pickup
Recreation
- Community Pool
Map
Home Values in the Area
Average Home Value in this Area
Tax History
| Year | Tax Paid | Tax Assessment Tax Assessment Total Assessment is a certain percentage of the fair market value that is determined by local assessors to be the total taxable value of land and additions on the property. | Land | Improvement |
|---|---|---|---|---|
| 2025 | $2,634 | $274,600 | $130,000 | $144,600 |
| 2024 | $2,634 | $271,500 | $130,000 | $141,500 |
| 2023 | $2,186 | $220,800 | $100,000 | $120,800 |
| 2022 | $2,018 | $203,800 | $95,000 | $108,800 |
| 2021 | $1,938 | $195,800 | $82,000 | $113,800 |
| 2020 | $1,913 | $188,000 | $82,000 | $106,000 |
| 2019 | $1,933 | $184,900 | $81,000 | $103,900 |
| 2018 | $1,854 | $184,900 | $81,000 | $103,900 |
| 2017 | $1,906 | $190,100 | $81,000 | $109,100 |
| 2016 | $1,799 | $181,700 | $76,400 | $105,300 |
| 2015 | $1,767 | $178,500 | $76,400 | $102,100 |
| 2014 | $1,622 | $177,300 | $83,000 | $94,300 |
Property History
| Date | Event | Price | List to Sale | Price per Sq Ft |
|---|---|---|---|---|
| 11/16/2025 11/16/25 | Price Changed | $275,000 | -3.5% | $222 / Sq Ft |
| 10/14/2025 10/14/25 | Price Changed | $285,000 | -5.0% | $230 / Sq Ft |
| 09/19/2025 09/19/25 | Price Changed | $300,000 | -4.8% | $242 / Sq Ft |
| 09/05/2025 09/05/25 | For Sale | $315,000 | -- | $254 / Sq Ft |
Purchase History
| Date | Type | Sale Price | Title Company |
|---|---|---|---|
| Deed | $195,000 | Old Republic Natl Ttl Ins Co | |
| Warranty Deed | $172,500 | -- | |
| Deed | $128,700 | -- | |
| Deed | $107,900 | -- |
Mortgage History
| Date | Status | Loan Amount | Loan Type |
|---|---|---|---|
| Previous Owner | $169,375 | FHA | |
| Previous Owner | $125,600 | FHA | |
| Previous Owner | $111,100 | No Value Available |
Source: Real Estate Information Network (REIN)
MLS Number: 10599954
APN: 2408-42-9581-1877
Disclaimer: Certain information contained herein is derived from information provided by parties other than Homes.com. All information provided is deemed reliable, but is not guaranteed to be accurate and should be independently verified.
![]() The listings data displayed on this medium comes in part from the Real Estate Information Network, Inc. (REIN) and has been authorized by participating listing Broker Members of REIN for display. REIN's listings are based upon Data submitted by its Broker Members, and REIN therefore makes no representation or warranty regarding the accuracy of the Data. All users of REIN's listings database should confirm the accuracy of the listing information directly with the listing agent.
The listings data displayed on this medium comes in part from the Real Estate Information Network, Inc. (REIN) and has been authorized by participating listing Broker Members of REIN for display. REIN's listings are based upon Data submitted by its Broker Members, and REIN therefore makes no representation or warranty regarding the accuracy of the Data. All users of REIN's listings database should confirm the accuracy of the listing information directly with the listing agent.
Copyright 2025 REIN. REIN's listings Data and information is protected under federal copyright laws. Federal law prohibits, among other acts, the unauthorized copying or alteration of, or preparation of derivative works from, all or any part of copyrighted materials, including certain compilations of Data and information. COPYRIGHT VIOLATORS MAY BE SUBJECT TO SEVERE FINES AND PENALTIES UNDER FEDERAL LAW.
REIN updates its listings on a daily basis.
Some listings may be duplicated in the search results due to the co-mingling of listings from more than one multiple listing service. Should there be different listing information between the duplicated listings; user is advised to verify the accuracy of the listing information before making any financial decisions.
Some or all of the listings (or listings Data) represented in this application have been enhanced with Data not provided by REIN. The enhancements are as follows: mapping, demographics, and economics. The source of these enhancements are: GreatSchools, CoStar, Google, Walk Score, How Loud, Collateral Analytics, Black Knight, First American, and Quantarium.
This application does not include information on all of the properties available for sale at this time.
- 1043 Hanson Way
- 1001 Autumn Woods Ln Unit 111
- 1816 Sechrist Ct
- MM Woodside @ Prosperity
- The Chelsea Plan at Prosperity At The Pines
- MM Chelsea @ Prosperity
- The Augusta Plan at Prosperity At The Pines
- The Savannah Plan at Prosperity At The Pines
- The Leigh Plan at Prosperity At The Pines
- The Harriet Plan at Prosperity At The Pines
- The Dimitri Plan at Prosperity At The Pines
- 1069 Colonial Meadows Way
- 916 Baillio Dr
- 1040 Collection Creek Way
- 960 Lindsley Dr
- 1880 Chantilly Ct Unit 1001
- 1833 Chantilly Ct Unit 305
- 1872 Eden Way
- 2001 Belvidere Rd
- 1501 N Horseshoe Cir
- 1004 Autumn Woods Ln Unit 101
- 1809 Colonial Arms Cir
- 947 Wildwood Square Ct
- 1807 Durham E
- 1870 Enterprise Ct
- 865 Windom Place
- 2134 Advent Ct
- 1701 Chase Pointe Cir
- 1997 Eastwood Villa Ln
- 356 S Chesire Ct
- 624 Suhtai Ct
- 2220 N Lakeside Dr
- 1413 Laskin Rd
- 2314 Cornick Dr
- 1817 Riddle Ave
- 1486 Old Virginia Beach Rd
- 1334 Linkhorn Cir
- 440 N Oceana Blvd
- 412 Chinaberry Cir
- 1400 Snow Goose Ln
