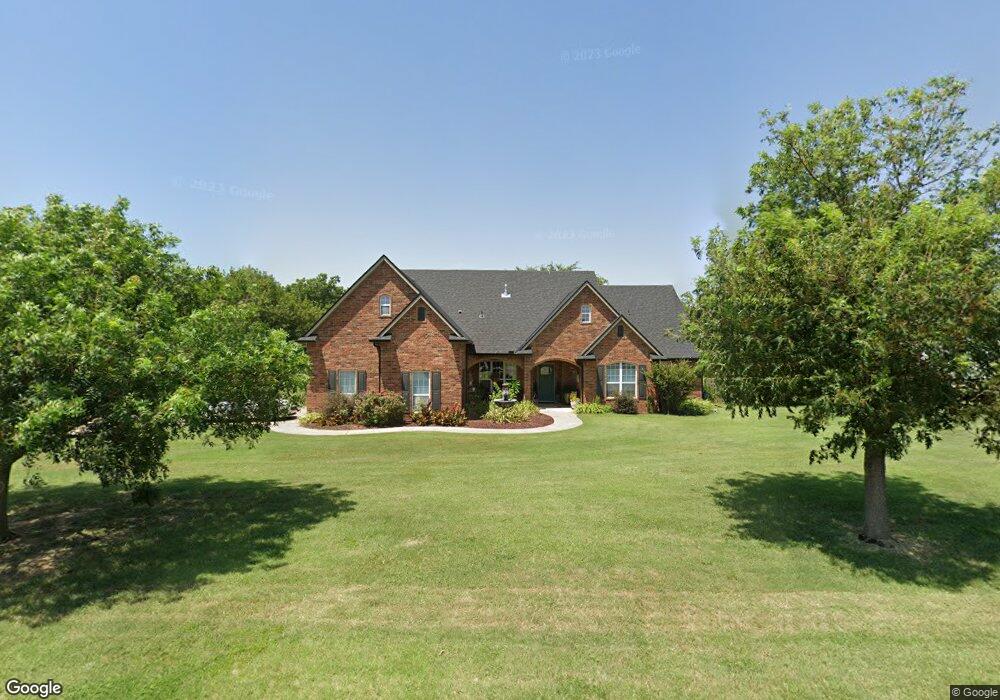
18775 308th St Norman, OK 73072
Estimated Value: $428,545 - $498,000
4
Beds
5
Baths
2,518
Sq Ft
$182/Sq Ft
Est. Value
About This Home
This home is located at 18775 308th St, Norman, OK 73072 and is currently estimated at $457,886, approximately $181 per square foot. 18775 308th St is a home located in McClain County with nearby schools including Jackson Elementary School, Alcott Middle School, and Norman High School.
Ownership History
Date
Name
Owned For
Owner Type
Purchase Details
Closed on
Feb 12, 2021
Sold by
Boler Raymond Wesley
Bought by
Boler Francina Rae
Current Estimated Value
Purchase Details
Closed on
Oct 15, 2020
Sold by
Lawson Raymond R and Guilbeau Francine M
Bought by
Lawson Raymond R and Guilbeau Francine M
Purchase Details
Closed on
Nov 13, 2009
Sold by
Derrick Kyle A and Derrick Ariel B
Bought by
Lawson Raymond R and Guilbeau Francine M
Home Financials for this Owner
Home Financials are based on the most recent Mortgage that was taken out on this home.
Original Mortgage
$208,000
Interest Rate
4.83%
Mortgage Type
New Conventional
Purchase Details
Closed on
Aug 15, 2006
Sold by
M & C Properties L L C
Bought by
Derrick Kyle A and Derrick Ariel B
Home Financials for this Owner
Home Financials are based on the most recent Mortgage that was taken out on this home.
Original Mortgage
$142,000
Interest Rate
6.75%
Mortgage Type
Construction
Create a Home Valuation Report for This Property
The Home Valuation Report is an in-depth analysis detailing your home's value as well as a comparison with similar homes in the area
Home Values in the Area
Average Home Value in this Area
Purchase History
| Date | Buyer | Sale Price | Title Company |
|---|---|---|---|
| Boler Francina Rae | -- | -- | |
| Lawson Raymond R | -- | None Available | |
| Lawson Raymond R | $260,000 | None Available | |
| Derrick Kyle A | $38,000 | Alliance Title Services |
Source: Public Records
Mortgage History
| Date | Status | Borrower | Loan Amount |
|---|---|---|---|
| Previous Owner | Lawson Raymond R | $208,000 | |
| Previous Owner | Derrick Kyle A | $142,000 |
Source: Public Records
Tax History
| Year | Tax Paid | Tax Assessment Tax Assessment Total Assessment is a certain percentage of the fair market value that is determined by local assessors to be the total taxable value of land and additions on the property. | Land | Improvement |
|---|---|---|---|---|
| 2025 | $3,942 | $38,615 | $4,459 | $34,156 |
| 2024 | $3,824 | $37,490 | $4,329 | $33,161 |
| 2023 | $3,824 | $36,398 | $4,148 | $32,250 |
| 2022 | $3,663 | $35,338 | $3,872 | $31,466 |
| 2021 | $3,726 | $35,338 | $3,872 | $31,466 |
| 2020 | $3,202 | $30,241 | $3,872 | $26,369 |
| 2019 | $3,380 | $31,562 | $3,485 | $28,077 |
| 2018 | $3,260 | $31,644 | $3,485 | $28,159 |
| 2017 | $3,189 | $30,929 | $3,485 | $27,444 |
| 2016 | $3,067 | $30,028 | $3,485 | $26,543 |
| 2015 | $3,064 | $30,342 | $2,657 | $27,685 |
| 2014 | $2,962 | $29,459 | $2,937 | $26,522 |
Source: Public Records
Map
Nearby Homes
- 18591 308th St
- 0000 308th St
- 18627 310th St
- 31169 Santa fe Ave
- 30462 Mesquite Tree Way
- 18444 Posse Trail
- 18485 Sleepy Deer Hollow
- 18455 Sleepy Deer Hollow
- 0 Sweetwater Village Unit 1205818
- 30128 Horseman Aly
- 30146 Horseman Aly
- 29980 E Ridge Rd
- 29954 E Ridge Rd
- 31814 Landrun Ave
- 18960 Cashton Ct
- 0 24th Ave
- 29840 E Ridge Rd
- 29654 E Ridge Rd
- 29800 E Ridge Rd
- 29820 E Ridge Rd