
Seller's Agent in 2025
Audra Padgett
Crossway Realty
(912) 286-1151
177 Total Sales
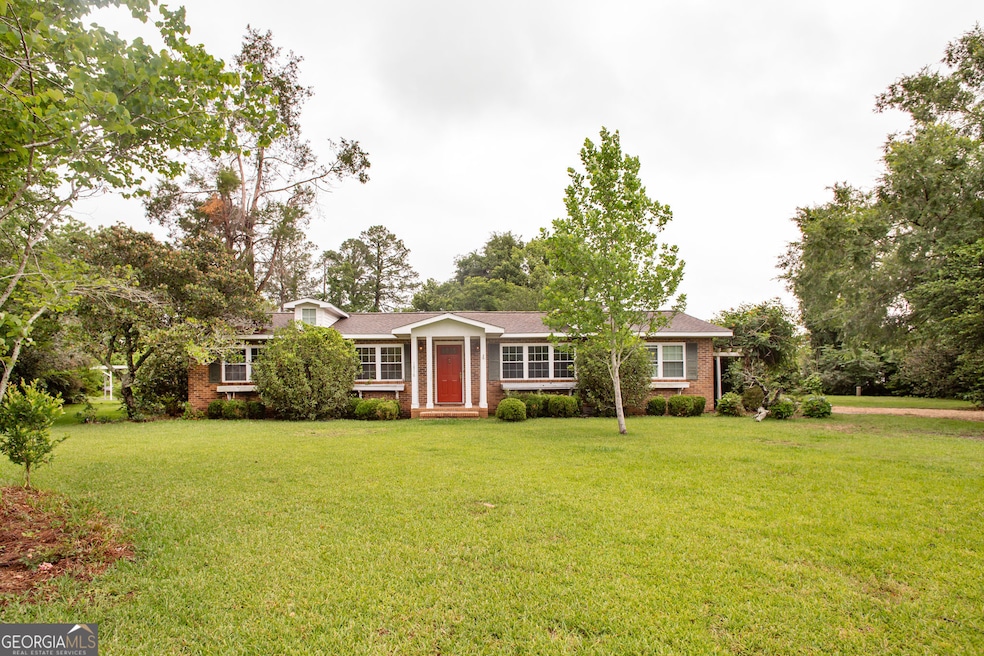
Welcome to 1878 Blalock, a classic brick home full of warmth and character! Nestled on a generous corner lot in the Jamestown area, this 3-bedroom, 2-bathroom home offers the perfect blend of original charm and thoughtful updates. Step inside to find beautiful hardwood floors flowing through the main living areas and brand-new flooring in all three bedrooms. Fresh interior paint gives the entire space a clean, modern feel. The layout includes a spacious family room, ideal for gatherings, plus a bright and airy sunroom right off the kitchen perfect for morning coffee, hobbies, or relaxing with a good book. Whether you're a first-time buyer, downsizing, or looking for your next investment, this home is full of potential and ready for its next chapter. Don't miss your chance to own a slice of Jamestown charm!
| Date | Type | Sale Price | Title Company |
|---|---|---|---|
| Warranty Deed | $226,000 | -- | |
| Warranty Deed | $205,000 | -- | |
| Gift Deed | -- | -- | |
| Deed | $25,000 | -- |
| Date | Status | Loan Amount | Loan Type |
|---|---|---|---|
| Open | $221,906 | FHA | |
| Previous Owner | $164,000 | New Conventional | |
| Previous Owner | $142,500 | Reverse Mortgage Home Equity Conversion Mortgage |
| Date | Event | Price | List to Sale | Price per Sq Ft |
|---|---|---|---|---|
| 09/05/2025 09/05/25 | Sold | $226,000 | -1.3% | $113 / Sq Ft |
| 09/03/2025 09/03/25 | Pending | -- | -- | -- |
| 06/30/2025 06/30/25 | For Sale | $229,000 | 0.0% | $115 / Sq Ft |
| 06/25/2025 06/25/25 | Pending | -- | -- | -- |
| 06/12/2025 06/12/25 | Price Changed | $229,000 | -4.2% | $115 / Sq Ft |
| 05/19/2025 05/19/25 | For Sale | $239,000 | -- | $120 / Sq Ft |
| Year | Tax Paid | Tax Assessment Tax Assessment Total Assessment is a certain percentage of the fair market value that is determined by local assessors to be the total taxable value of land and additions on the property. | Land | Improvement |
|---|---|---|---|---|
| 2024 | $1,966 | $68,504 | $3,816 | $64,688 |
| 2023 | $1,763 | $58,064 | $4,240 | $53,824 |
| 2022 | $452 | $58,064 | $4,240 | $53,824 |
| 2021 | $440 | $48,630 | $4,240 | $44,390 |
| 2020 | $350 | $32,963 | $4,240 | $28,723 |
| 2019 | $427 | $35,841 | $4,240 | $31,601 |
| 2018 | $405 | $34,336 | $4,240 | $30,096 |
| 2017 | $405 | $34,336 | $4,240 | $30,096 |
| 2016 | $405 | $34,336 | $4,240 | $30,096 |
| 2015 | $408 | $34,336 | $4,240 | $30,096 |
| 2014 | $406 | $34,336 | $4,240 | $30,096 |
| 2013 | -- | $34,336 | $4,240 | $30,096 |
Seller's Agent in 2025
Audra Padgett
Crossway Realty
(912) 286-1151
177 Total Sales
Buyer's Agent in 2025
Chris Van Olphen
Keller Williams Community Partners
(404) 997-2065
440 Total Sales
Source: Georgia MLS
MLS Number: 10525711
APN: 036H01-014
Disclaimer: Certain information contained herein is derived from information provided by parties other than Homes.com. All information provided is deemed reliable, but is not guaranteed to be accurate and should be independently verified.
![]() The data relating to real estate for sale on this web site comes in part from the Broker Reciprocity Program of Georgia MLS. Real estate listings held by brokerage firms other than Redfin are marked with the Broker Reciprocity logo and detailed information about them includes the name of the listing brokers. Information deemed reliable but not guaranteed. Copyright 2025 Georgia MLS. All rights reserved.
The data relating to real estate for sale on this web site comes in part from the Broker Reciprocity Program of Georgia MLS. Real estate listings held by brokerage firms other than Redfin are marked with the Broker Reciprocity logo and detailed information about them includes the name of the listing brokers. Information deemed reliable but not guaranteed. Copyright 2025 Georgia MLS. All rights reserved.