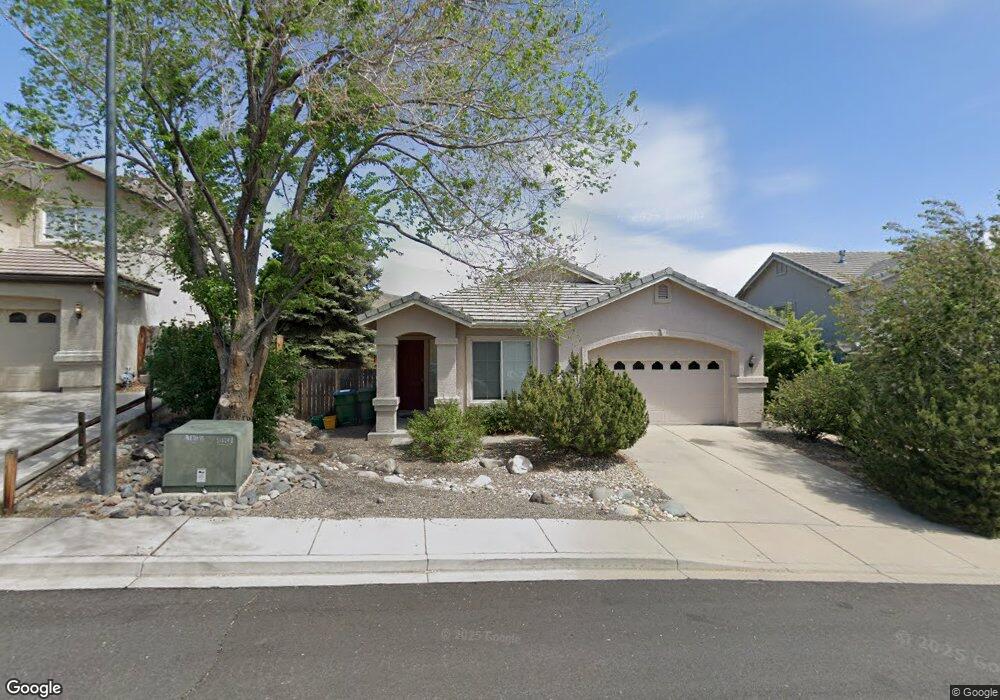
1878 Cambridge Hills Ct Reno, NV 89523
Northgate NeighborhoodEstimated Value: $550,240 - $580,000
3
Beds
2
Baths
1,294
Sq Ft
$434/Sq Ft
Est. Value
About This Home
This home is located at 1878 Cambridge Hills Ct, Reno, NV 89523 and is currently estimated at $561,310, approximately $433 per square foot. 1878 Cambridge Hills Ct is a home located in Washoe County with nearby schools including B D Billinghurst Middle School, Robert McQueen High School, and The King's Academy.
Ownership History
Date
Name
Owned For
Owner Type
Purchase Details
Closed on
Nov 28, 2017
Sold by
Fallis Pr0perties Llc
Bought by
Kimberlin Pamela S
Current Estimated Value
Home Financials for this Owner
Home Financials are based on the most recent Mortgage that was taken out on this home.
Original Mortgage
$330,560
Outstanding Balance
$277,870
Interest Rate
3.88%
Mortgage Type
VA
Estimated Equity
$283,440
Purchase Details
Closed on
Jul 22, 2005
Sold by
Wolf Herbert H and Wolf Maria
Bought by
Fallis Properties Llc
Home Financials for this Owner
Home Financials are based on the most recent Mortgage that was taken out on this home.
Original Mortgage
$205,200
Interest Rate
5.51%
Mortgage Type
Stand Alone First
Purchase Details
Closed on
Dec 19, 2001
Sold by
Bailey and Bailey Dutton
Bought by
Wolf Herbert H and Wolf Maria
Create a Home Valuation Report for This Property
The Home Valuation Report is an in-depth analysis detailing your home's value as well as a comparison with similar homes in the area
Home Values in the Area
Average Home Value in this Area
Purchase History
| Date | Buyer | Sale Price | Title Company |
|---|---|---|---|
| Kimberlin Pamela S | $320,000 | Capital Title Co Of Ne | |
| Fallis Properties Llc | $342,000 | Stewart Title Of Northern Nv | |
| Wolf Herbert H | $180,500 | Stewart Title Northern Nevad |
Source: Public Records
Mortgage History
| Date | Status | Borrower | Loan Amount |
|---|---|---|---|
| Open | Kimberlin Pamela S | $330,560 | |
| Previous Owner | Fallis Properties Llc | $205,200 |
Source: Public Records
Tax History Compared to Growth
Tax History
| Year | Tax Paid | Tax Assessment Tax Assessment Total Assessment is a certain percentage of the fair market value that is determined by local assessors to be the total taxable value of land and additions on the property. | Land | Improvement |
|---|---|---|---|---|
| 2025 | $2,390 | $103,644 | $43,575 | $60,069 |
| 2024 | $2,390 | $96,295 | $35,735 | $60,560 |
| 2023 | $2,321 | $96,907 | $39,585 | $57,322 |
| 2022 | $2,254 | $81,407 | $33,565 | $47,842 |
| 2021 | $2,189 | $74,376 | $26,775 | $47,601 |
| 2020 | $2,123 | $74,518 | $26,810 | $47,708 |
| 2019 | $2,061 | $72,369 | $26,810 | $45,559 |
| 2018 | $1,980 | $63,527 | $19,775 | $43,752 |
| 2017 | $1,923 | $62,328 | $18,515 | $43,813 |
| 2016 | $1,874 | $62,389 | $17,605 | $44,784 |
| 2015 | $1,871 | $59,707 | $15,015 | $44,692 |
| 2014 | $1,813 | $56,132 | $12,950 | $43,182 |
| 2013 | -- | $48,003 | $9,695 | $38,308 |
Source: Public Records
Map
Nearby Homes
- 1836 Cambridge Hills Ct
- 6811 Sonterra Ln
- 6460 Valley Wood Dr
- 2014 Cradle Mountain Dr Unit 2
- 2163 3 Wood Ln
- 1664 Shadow Wood Rd
- 2365 Red Maple Ct
- 6368 Springwood Dr
- 1055 Udowski Unit Homesite 53
- 1025 Udowski Unit Homesite 56
- 0 Unit 250003854
- 1651 Ashbury Ln
- 6673 Enchanted Valley Dr
- 7350 Austin Creek Ct
- 6440 Enchanted Valley Dr
- 1585 Springfield Park Dr Unit 16G
- 1410 Crosswater Dr
- 1931 E Minaret Cir
- 2730 Avenida de Landa
- 2605 Snow Partridge Dr
- 1884 Cambridge Hills Ct
- 1872 Cambridge Hills Ct
- 1890 Cambridge Hills Ct
- 1866 Cambridge Hills Ct
- 1865 Cambridge Hills Ct
- 1871 Cambridge Hills Ct
- 1896 Cambridge Hills Ct
- 1860 Cambridge Hills Ct
- 1859 Cambridge Hills Ct
- 1877 Cambridge Hills Ct
- 1895 Cambridge Hills Ct
- 1854 Cambridge Hills Ct
- 1883 Cambridge Hills Ct
- 1889 Cambridge Hills Ct
- 1853 Cambridge Hills Ct
- 1848 Cambridge Hills Ct
- 1847 Cambridge Hills Ct Unit 18B
- 1841 Cambridge Hills Ct
- 6699 Valley Wood Dr
- 6690 Stone Valley Dr