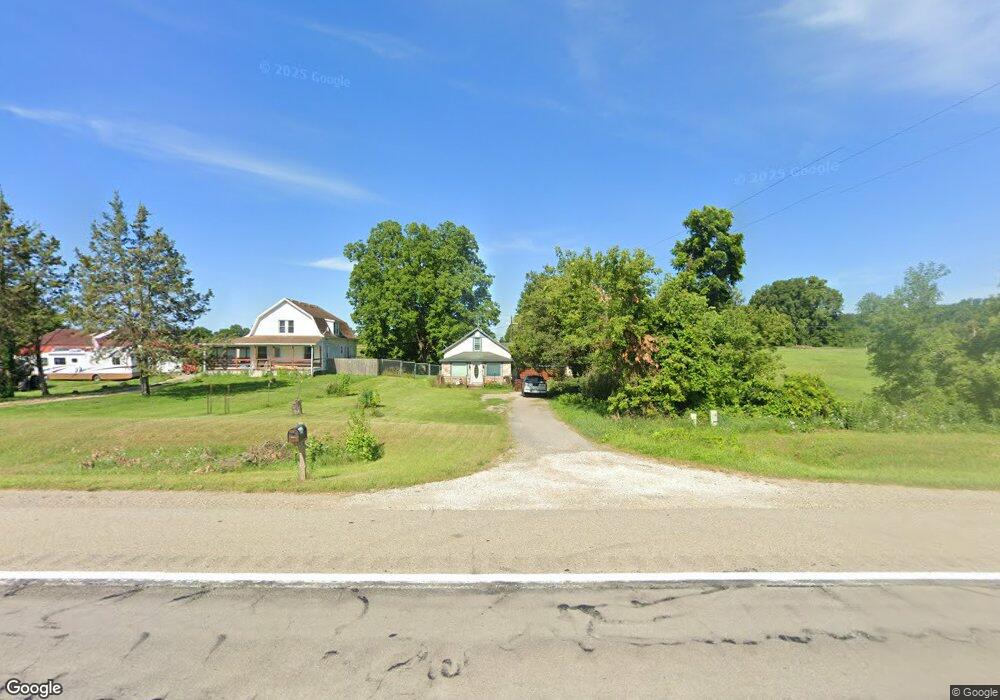
1878 N M-52 Update, MI 49285
Estimated Value: $177,293 - $280,000
3
Beds
1
Bath
1,496
Sq Ft
$150/Sq Ft
Est. Value
About This Home
This home is located at 1878 N M-52, Update, MI 49285 and is currently estimated at $224,823, approximately $150 per square foot. 1878 N M-52 is a home located in Ingham County with nearby schools including Dansville Elementary School, Dansville Middle School, and Dansville High School.
Ownership History
Date
Name
Owned For
Owner Type
Purchase Details
Closed on
Feb 11, 2019
Sold by
Wetzel Richard
Bought by
Wetzel Richard and Wetzel Caitlin Boyle
Current Estimated Value
Purchase Details
Closed on
Jun 28, 2017
Sold by
Rice Eric B and Rice Suzanne M
Bought by
Wetzel Richard
Home Financials for this Owner
Home Financials are based on the most recent Mortgage that was taken out on this home.
Original Mortgage
$148,117
Outstanding Balance
$123,263
Interest Rate
3.95%
Mortgage Type
VA
Estimated Equity
$101,560
Purchase Details
Closed on
Mar 23, 2001
Sold by
Burke Terrence T and Burke Barbara J
Bought by
Rice Eric B and Rice Suzanne M
Home Financials for this Owner
Home Financials are based on the most recent Mortgage that was taken out on this home.
Original Mortgage
$98,620
Interest Rate
7.02%
Mortgage Type
FHA
Create a Home Valuation Report for This Property
The Home Valuation Report is an in-depth analysis detailing your home's value as well as a comparison with similar homes in the area
Home Values in the Area
Average Home Value in this Area
Purchase History
| Date | Buyer | Sale Price | Title Company |
|---|---|---|---|
| Wetzel Richard | -- | None Available | |
| Wetzel Richard | $145,000 | Tri County Title Agency Llc | |
| Rice Eric B | $99,400 | -- |
Source: Public Records
Mortgage History
| Date | Status | Borrower | Loan Amount |
|---|---|---|---|
| Open | Wetzel Richard | $148,117 | |
| Previous Owner | Rice Eric B | $98,620 |
Source: Public Records
Tax History
| Year | Tax Paid | Tax Assessment Tax Assessment Total Assessment is a certain percentage of the fair market value that is determined by local assessors to be the total taxable value of land and additions on the property. | Land | Improvement |
|---|---|---|---|---|
| 2025 | $82 | $88,500 | $4,300 | $84,200 |
| 2024 | $121 | $86,600 | $4,300 | $82,300 |
| 2023 | $1,536 | $71,400 | $3,800 | $67,600 |
| 2022 | $1,536 | $63,700 | $3,800 | $59,900 |
| 2021 | $1,536 | $58,600 | $0 | $0 |
| 2020 | $2,113 | $57,100 | $0 | $0 |
| 2019 | $2,031 | $54,600 | $3,700 | $50,900 |
| 2018 | $2,053 | $48,600 | $3,700 | $44,900 |
| 2017 | $1,205 | $47,600 | $3,300 | $44,300 |
| 2016 | -- | $45,200 | $2,900 | $42,300 |
| 2015 | -- | $39,500 | $5,700 | $33,800 |
| 2014 | -- | $38,600 | $5,700 | $32,900 |
Source: Public Records
Map
Nearby Homes
- 2855 Oakley Rd
- 4025 Oakley Rd
- 2980 Budd Rd
- 3847 Minix Dr
- 5367 E M 36
- V/L Kleinschmidt Rd
- 3468 Catholic Church Rd
- 3534 Dexter Trail
- 00 N M-52 Ville
- 2280 Swan Rd
- 2131 Ewers Rd
- 2901 Parman Rd
- 9855 Iosco Ridge Dr
- 1068 Crocus Trail
- 2343 Skeeter Ln
- 5663 Iosco Mountain Rd
- 0 Ashlyn Ct
- 0000 Chapman Rd
- 0 Adelines (Lot 19) Way Unit 217036320
- 0 Adelines (Lot 20) Way Unit 217036090
- 1878 Michigan 52
- 1878 N M 52 Unit M52
- 1884 N M-52
- 1884 M52
- 1884 Michigan 52 Unit M52
- 1884 Michigan 52
- 1884 Stockbridge Rd Unit m-52
- 1884 N M 52
- 4301 Millville Rd
- 2487 N M 52
- 1832 N M 52
- 4301 Llville
- 1980 N M 52
- 2002 N M 52 Unit M52
- 4197 Carter Rd
- 1739 N M 52
- 1739 Stockbridge Rd
- 4185 Carter Rd
- 1740 N M 52
- 0 Millville Rd
Your Personal Tour Guide
Ask me questions while you tour the home.