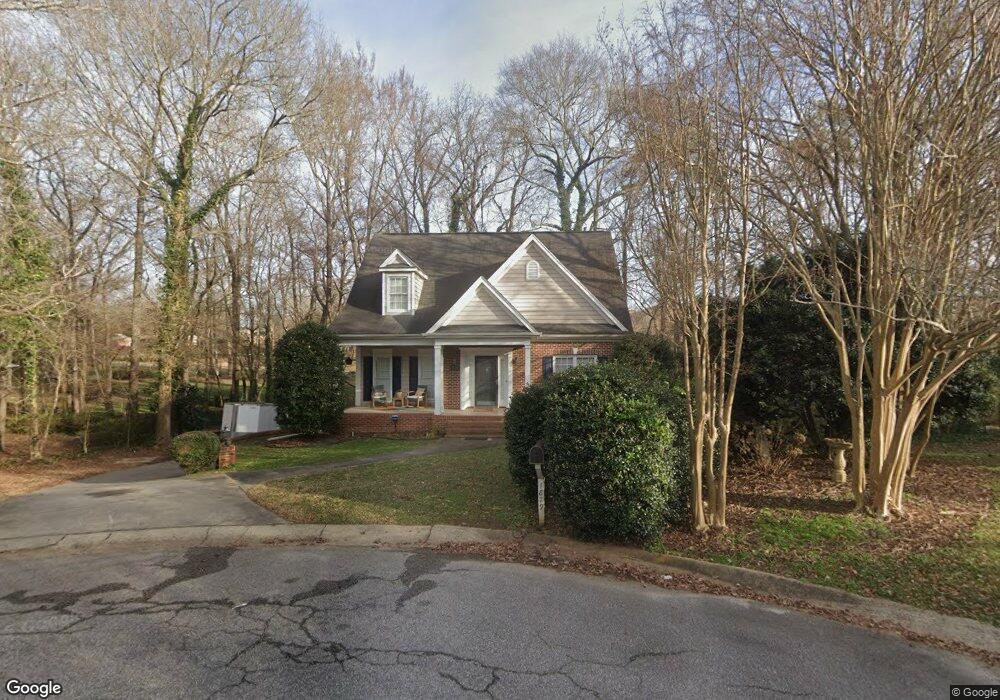
1879 Carriage Ct Rock Hill, SC 29732
Estimated Value: $415,723 - $456,000
3
Beds
3
Baths
2,041
Sq Ft
$212/Sq Ft
Est. Value
About This Home
This home is located at 1879 Carriage Ct, Rock Hill, SC 29732 and is currently estimated at $432,931, approximately $212 per square foot. 1879 Carriage Ct is a home located in York County with nearby schools including Ebinport Elementary School, Rawlinson Road Middle School, and South Pointe High School.
Ownership History
Date
Name
Owned For
Owner Type
Purchase Details
Closed on
Jun 28, 2013
Sold by
Hailey Mary Paige and Wylie Mary Paige
Bought by
Simon Kenton L and Simon Trekeelia B
Current Estimated Value
Home Financials for this Owner
Home Financials are based on the most recent Mortgage that was taken out on this home.
Original Mortgage
$184,594
Outstanding Balance
$134,790
Interest Rate
3.79%
Mortgage Type
FHA
Estimated Equity
$298,141
Purchase Details
Closed on
Aug 20, 2007
Sold by
Jacobson Robert C
Bought by
Hailey Mary Paige
Home Financials for this Owner
Home Financials are based on the most recent Mortgage that was taken out on this home.
Original Mortgage
$33,525
Interest Rate
6.7%
Mortgage Type
Credit Line Revolving
Purchase Details
Closed on
Sep 29, 2003
Sold by
Horton Rebecca Joan
Bought by
Jacobson Robert C and Jacobson Rhonda H
Purchase Details
Closed on
May 18, 1999
Sold by
Carolina South Corp
Bought by
Horton Rebecca J
Create a Home Valuation Report for This Property
The Home Valuation Report is an in-depth analysis detailing your home's value as well as a comparison with similar homes in the area
Home Values in the Area
Average Home Value in this Area
Purchase History
| Date | Buyer | Sale Price | Title Company |
|---|---|---|---|
| Simon Kenton L | $188,000 | -- | |
| Hailey Mary Paige | $223,500 | None Available | |
| Jacobson Robert C | $201,000 | -- | |
| Horton Rebecca J | $15,000 | -- |
Source: Public Records
Mortgage History
| Date | Status | Borrower | Loan Amount |
|---|---|---|---|
| Open | Simon Kenton L | $41,151 | |
| Open | Simon Kenton L | $184,594 | |
| Previous Owner | Wylie Mary P | $218,864 | |
| Previous Owner | Hailey Mary Paige | $33,525 | |
| Previous Owner | Hailey Mary Paige | $178,800 |
Source: Public Records
Tax History Compared to Growth
Tax History
| Year | Tax Paid | Tax Assessment Tax Assessment Total Assessment is a certain percentage of the fair market value that is determined by local assessors to be the total taxable value of land and additions on the property. | Land | Improvement |
|---|---|---|---|---|
| 2024 | $1,838 | $8,376 | $1,280 | $7,096 |
| 2023 | $1,843 | $8,376 | $1,280 | $7,096 |
| 2022 | $1,855 | $8,376 | $1,280 | $7,096 |
| 2021 | -- | $8,376 | $1,280 | $7,096 |
| 2020 | $1,859 | $8,376 | $0 | $0 |
| 2019 | $1,718 | $7,500 | $0 | $0 |
| 2018 | $1,715 | $7,500 | $0 | $0 |
| 2017 | $1,652 | $7,500 | $0 | $0 |
| 2016 | $1,637 | $7,500 | $0 | $0 |
| 2014 | $1,701 | $11,250 | $1,920 | $9,330 |
| 2013 | $1,701 | $12,270 | $2,280 | $9,990 |
Source: Public Records
Map
Nearby Homes
- 2014 Steeplechase Dr
- 150 Brookwood Ln
- 1904 Steeplechase Dr
- 297 Notable Ln
- 311 Notable Ln
- 1910 Ebenezer Rd
- 1830 Ebenezer Rd Unit 1
- 412 Osborn St
- 555 Stockton Way
- 1806 Ebenezer Rd Unit E
- 1821 Huntington Place
- 1784 Ebenezer Rd
- 418 Tysons Forest Dr
- 1792 Ebenezer Rd Unit G
- 2345 Nuthatch Dr
- 130 Bailey Ave
- 1627 Jonesberry Dr
- 2317 Kestrel Dr
- 254 Tradition Way
- 2210 Canberra Dr
- 1878 Carriage Ct
- 205 Brookwood Ln
- 1883 Carriage Ct
- 1882 Carriage Ct
- 190 Brookwood Ln
- 1888 Carriage Ct
- 2014 Steeplechase Dr
- 195 Brookwood Ln
- 2018 Steeplechase Dr
- 2004 Steeplechase Dr
- 1996 Steeplechase Dr
- 183 Brookwood Ln
- 1990 Steeplechase Dr
- 172 Brookwood Ln
- 1984 Steeplechase Dr
- 177 Brookwood Ln
- 2023 Steeplechase Dr
- 2015 Steeplechase Dr
- 1978 Steeplechase Dr
- 2009 Steeplechase Dr