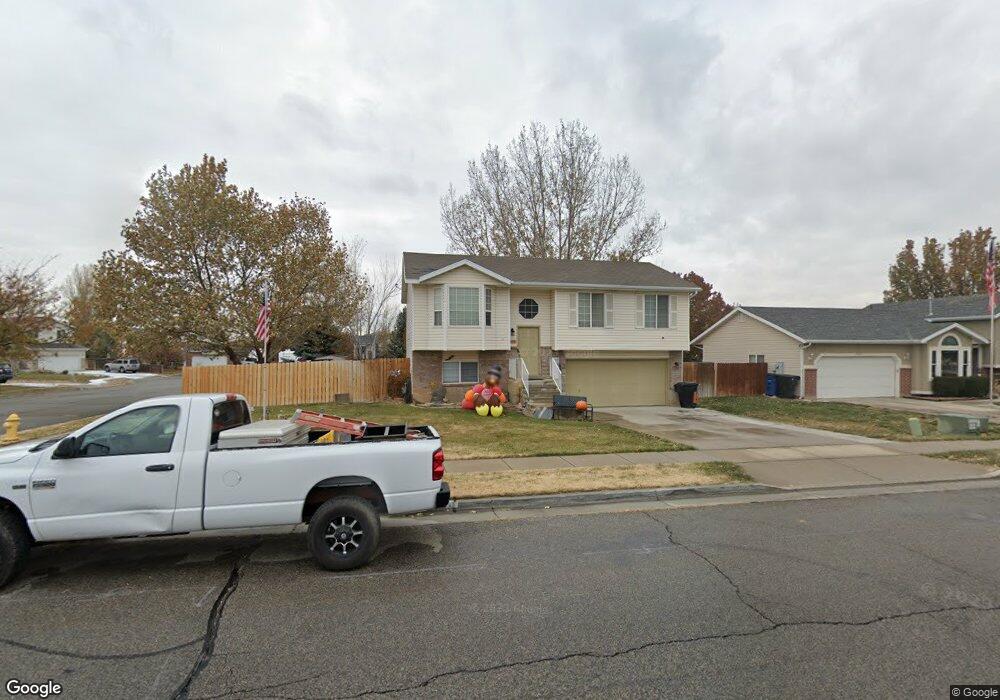
1879 N 810 W Clearfield, UT 84015
Estimated Value: $428,000 - $442,000
3
Beds
2
Baths
1,720
Sq Ft
$253/Sq Ft
Est. Value
About This Home
This home is located at 1879 N 810 W, Clearfield, UT 84015 and is currently estimated at $434,430, approximately $252 per square foot. 1879 N 810 W is a home located in Davis County with nearby schools including Fremont School, Sunset Junior High School, and Northridge High School.
Ownership History
Date
Name
Owned For
Owner Type
Purchase Details
Closed on
Dec 18, 2020
Sold by
Fong Willie and Fong Melissa
Bought by
Fmtr Willie and Fmtr Melissa
Current Estimated Value
Purchase Details
Closed on
Nov 15, 2005
Sold by
Watts Jeffrey A and Watts Linda J
Bought by
Kranz Brady and Kranz Jennie
Purchase Details
Closed on
Feb 18, 2000
Sold by
Higley & Higley Construction Inc
Bought by
Watts Jeffrey A and Watts Linda J
Home Financials for this Owner
Home Financials are based on the most recent Mortgage that was taken out on this home.
Original Mortgage
$105,648
Interest Rate
8.14%
Mortgage Type
FHA
Create a Home Valuation Report for This Property
The Home Valuation Report is an in-depth analysis detailing your home's value as well as a comparison with similar homes in the area
Home Values in the Area
Average Home Value in this Area
Purchase History
| Date | Buyer | Sale Price | Title Company |
|---|---|---|---|
| Fmtr Willie | -- | None Available | |
| Kranz Brady | -- | Executive Title Ins Agency | |
| Watts Jeffrey A | -- | Bonneville Title Company Inc |
Source: Public Records
Mortgage History
| Date | Status | Borrower | Loan Amount |
|---|---|---|---|
| Previous Owner | Watts Jeffrey A | $105,648 |
Source: Public Records
Tax History
| Year | Tax Paid | Tax Assessment Tax Assessment Total Assessment is a certain percentage of the fair market value that is determined by local assessors to be the total taxable value of land and additions on the property. | Land | Improvement |
|---|---|---|---|---|
| 2025 | $2,191 | $210,650 | $80,897 | $129,753 |
| 2024 | $2,111 | $204,049 | $89,417 | $114,632 |
| 2023 | $1,935 | $190,300 | $55,477 | $134,822 |
| 2022 | $2,051 | $369,000 | $114,123 | $254,877 |
| 2021 | $1,867 | $274,000 | $76,779 | $197,221 |
| 2020 | $1,618 | $235,000 | $64,305 | $170,695 |
| 2019 | $1,557 | $221,000 | $76,887 | $144,113 |
| 2018 | $1,427 | $199,000 | $65,172 | $133,828 |
| 2016 | $1,246 | $89,705 | $25,180 | $64,525 |
| 2015 | $1,273 | $87,120 | $25,180 | $61,940 |
| 2014 | $1,253 | $87,106 | $25,180 | $61,926 |
| 2013 | -- | $86,688 | $27,143 | $59,545 |
Source: Public Records
Map
Nearby Homes
Your Personal Tour Guide
Ask me questions while you tour the home.