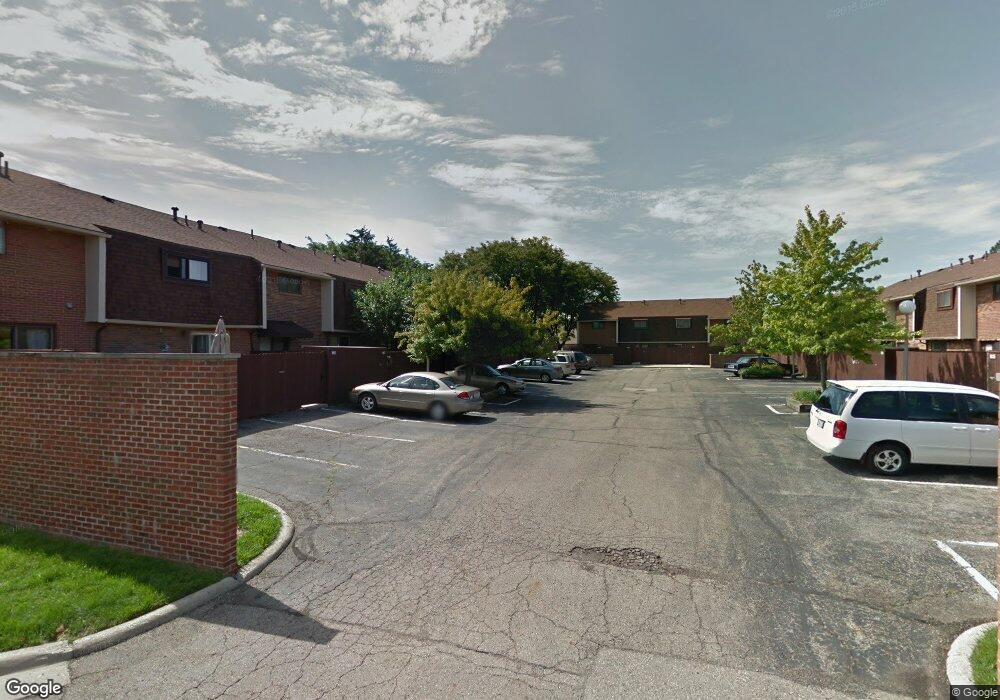
1879 Willoway Cir N Unit 1879 Columbus, OH 43220
Northcrest NeighborhoodEstimated Value: $205,000 - $229,000
3
Beds
2
Baths
1,240
Sq Ft
$177/Sq Ft
Est. Value
About This Home
This home is located at 1879 Willoway Cir N Unit 1879, Columbus, OH 43220 and is currently estimated at $219,913, approximately $177 per square foot. 1879 Willoway Cir N Unit 1879 is a home located in Franklin County with nearby schools including Winterset Elementary School, Ridgeview Middle School, and Centennial High School.
Ownership History
Date
Name
Owned For
Owner Type
Purchase Details
Closed on
Jun 5, 2014
Sold by
Yates Robert E and Yates Carolyn J
Bought by
Yates Carolyn J
Current Estimated Value
Purchase Details
Closed on
Jul 21, 2004
Sold by
Elliott Pamela
Bought by
Yates Robert E and Yates Carolyn J
Home Financials for this Owner
Home Financials are based on the most recent Mortgage that was taken out on this home.
Original Mortgage
$47,750
Interest Rate
6.34%
Mortgage Type
Purchase Money Mortgage
Purchase Details
Closed on
Jul 5, 2002
Sold by
Elliott Michael A
Bought by
Elliott Pamela
Purchase Details
Closed on
May 28, 1998
Sold by
Elliott Michael A
Bought by
Elliot Michael A and Elliot Pamela
Purchase Details
Closed on
Sep 1, 1980
Create a Home Valuation Report for This Property
The Home Valuation Report is an in-depth analysis detailing your home's value as well as a comparison with similar homes in the area
Home Values in the Area
Average Home Value in this Area
Purchase History
| Date | Buyer | Sale Price | Title Company |
|---|---|---|---|
| Yates Carolyn J | -- | None Available | |
| Yates Robert E | $95,000 | Title First | |
| Elliott Pamela | -- | -- | |
| Elliot Michael A | -- | -- | |
| -- | $50,500 | -- |
Source: Public Records
Mortgage History
| Date | Status | Borrower | Loan Amount |
|---|---|---|---|
| Previous Owner | Yates Robert E | $47,750 |
Source: Public Records
Tax History Compared to Growth
Tax History
| Year | Tax Paid | Tax Assessment Tax Assessment Total Assessment is a certain percentage of the fair market value that is determined by local assessors to be the total taxable value of land and additions on the property. | Land | Improvement |
|---|---|---|---|---|
| 2024 | $5,495 | $57,790 | $5,600 | $52,190 |
| 2023 | $2,615 | $57,790 | $5,600 | $52,190 |
| 2022 | $2,251 | $42,350 | $5,460 | $36,890 |
| 2021 | $2,255 | $42,350 | $5,460 | $36,890 |
| 2020 | $2,258 | $42,350 | $5,460 | $36,890 |
| 2019 | $2,027 | $32,590 | $4,200 | $28,390 |
| 2018 | $1,929 | $32,590 | $4,200 | $28,390 |
| 2017 | $2,020 | $32,590 | $4,200 | $28,390 |
| 2016 | $2,014 | $29,650 | $4,270 | $25,380 |
| 2015 | $1,834 | $29,650 | $4,270 | $25,380 |
| 2014 | $1,838 | $29,650 | $4,270 | $25,380 |
| 2013 | $978 | $32,900 | $4,725 | $28,175 |
Source: Public Records
Map
Nearby Homes
- 1865 Willoway Cir N Unit 1865
- 1835 Willoway Cir N
- 4924 Reed Rd Unit B
- 1739 Paula Dr Unit 1739
- 4740 Merrifield Place Unit 25
- 5111 Schuylkill St
- 5268 Captains Ct
- 5111 Portland St
- 1558 Denbigh Dr
- 2165 Partlow Dr
- 2172 Hedgerow Rd Unit 2172G
- 4781 Coach Rd
- 2198 Sandston Rd
- 2231 Atlee Ct Unit 12
- 1466 Weybridge Rd
- 2179 Victoria Park Dr Unit 2179
- 4861 Etrick Dr Unit 22
- 4818 -4820 Winterset Dr
- 5283 Ruthton Rd Unit 19
- 1594 Lafayette Dr Unit 1594
- 1877 Willoway Cir N
- 1879 Willoway Cir N
- 1875 Willoway Cir N Unit 1875
- 1873 Willoway Cir N
- 1847 Willoway Cir N
- 1845 Willoway Cir N
- 1881 Willoway Cir N Unit 1881
- 1871 Willoway Cir N Unit 1871
- 1871 Willoway Cir N
- 1871 Willoway Cir N Unit BLDG
- 1851 Willoway Cir N
- 1883 Willoway Cir N Unit 1883
- 1849 Willoway Cir N Unit 1849
- 1885 Willoway Cir N Unit 1885
- 1869 Willoway Cir N
- 1878 Willoway Cir S
- 1867 Willoway Cir N
- 1887 Willoway Cir N
- 1887 Willoway Cir N Unit 1887
- 1855 Willoway Cir N Unit 1855