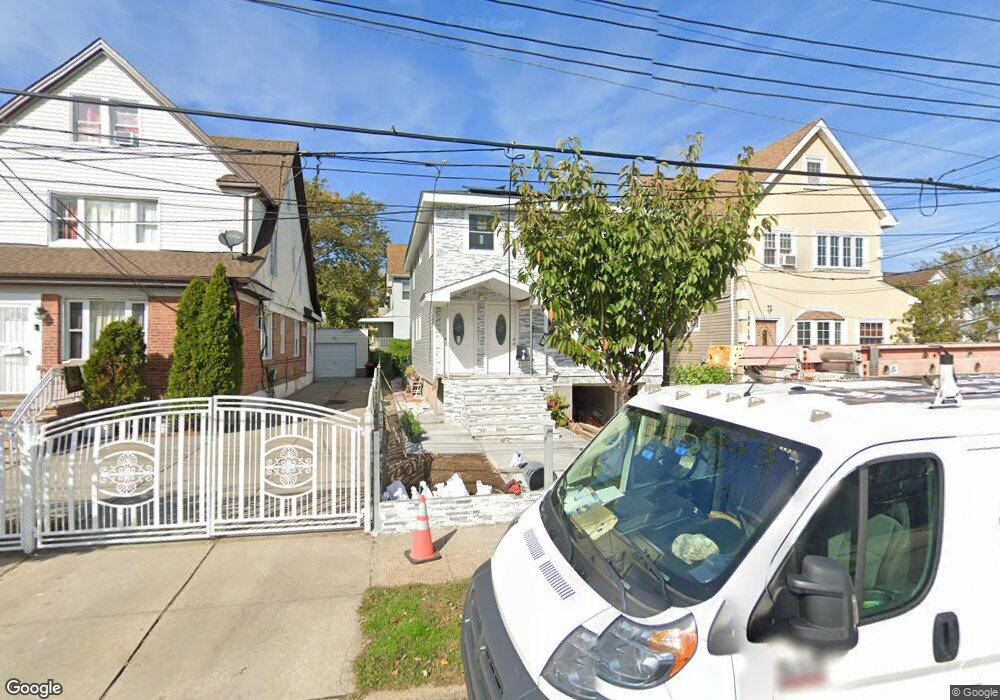
188-15 Ludlum Ave Unit 2 Saint Albans, NY 11412
Hollis NeighborhoodEstimated Value: $817,976 - $966,000
3
Beds
1
Bath
1,994
Sq Ft
$444/Sq Ft
Est. Value
About This Home
This home is located at 188-15 Ludlum Ave Unit 2, Saint Albans, NY 11412 and is currently estimated at $885,994, approximately $444 per square foot. 188-15 Ludlum Ave Unit 2 is a home located in Queens County with nearby schools including P.S. 118 Lorraine Hansberry, I.S. 192 The Linden, and Wellspring Elementary & Middle.
Ownership History
Date
Name
Owned For
Owner Type
Purchase Details
Closed on
Nov 5, 2018
Sold by
Charles Lawrence J and Charles Magdalene
Bought by
Singh Tatari and Singh Thakuradyal
Current Estimated Value
Purchase Details
Closed on
Jul 3, 2014
Sold by
Autar Chandrama and Autar Michael Devchand
Bought by
Charles Lawrence J and Charles Magdalene
Home Financials for this Owner
Home Financials are based on the most recent Mortgage that was taken out on this home.
Original Mortgage
$358,000
Interest Rate
4.11%
Mortgage Type
New Conventional
Purchase Details
Closed on
Feb 7, 2014
Sold by
Francis Edna and James And Edna Francis Trust
Bought by
Autar Chandrama and Devchand Autar Michael
Home Financials for this Owner
Home Financials are based on the most recent Mortgage that was taken out on this home.
Original Mortgage
$167,887
Interest Rate
4.5%
Mortgage Type
New Conventional
Create a Home Valuation Report for This Property
The Home Valuation Report is an in-depth analysis detailing your home's value as well as a comparison with similar homes in the area
Home Values in the Area
Average Home Value in this Area
Purchase History
| Date | Buyer | Sale Price | Title Company |
|---|---|---|---|
| Singh Tatari | $499,000 | -- | |
| Singh Tatari | $499,000 | -- | |
| Charles Lawrence J | $358,000 | -- | |
| Charles Lawrence J | $358,000 | -- | |
| Autar Chandrama | $215,000 | -- | |
| Autar Chandrama | $215,000 | -- |
Source: Public Records
Mortgage History
| Date | Status | Borrower | Loan Amount |
|---|---|---|---|
| Previous Owner | Charles Lawrence J | $358,000 | |
| Previous Owner | Autar Chandrama | $167,887 |
Source: Public Records
Tax History Compared to Growth
Tax History
| Year | Tax Paid | Tax Assessment Tax Assessment Total Assessment is a certain percentage of the fair market value that is determined by local assessors to be the total taxable value of land and additions on the property. | Land | Improvement |
|---|---|---|---|---|
| 2025 | $7,398 | $39,042 | $13,912 | $25,130 |
| 2024 | $4,824 | $36,832 | $15,163 | $21,669 |
| 2023 | $7,263 | $36,163 | $16,366 | $19,797 |
| 2022 | $6,912 | $39,000 | $18,600 | $20,400 |
| 2021 | $6,204 | $34,200 | $18,600 | $15,600 |
| 2020 | $6,016 | $31,020 | $15,780 | $15,240 |
| 2019 | $4,858 | $24,420 | $12,720 | $11,700 |
| 2018 | $1,060 | $22,666 | $10,095 | $12,571 |
| 2017 | $2,315 | $21,384 | $11,867 | $9,517 |
| 2016 | $2,225 | $21,384 | $11,867 | $9,517 |
| 2015 | $2,081 | $20,514 | $11,155 | $9,359 |
| 2014 | $2,081 | $19,353 | $11,592 | $7,761 |
Source: Public Records
Map
Nearby Homes
- 10533 Farmers Blvd
- 19027 109th Rd
- 187-23 Brinkerhoff Ave
- 102-35 187th St
- 10532 192nd St
- 190-30 103rd Ave
- 10220 189th St
- 10211 187th St
- 193-21 109th Rd
- 104-40 194th St
- 19319 109th Rd
- 194-10 Hollis Ave
- 185-05 Henderson Ave
- 111-06 Farmers Blvd
- 184-15 Henderson Ave
- 102-13 183rd Place
- 183-29 Brinkerhoff Ave
- 183-09 Dunlop Ave
- 186-16 Hilburn Ave
- 183-12 Elmira Ave
- 188-15 Ludlum Ave
- 18815 Ludlum Ave
- 188-19 Ludlum Ave Unit Room 2
- 188-19 Ludlum Ave Unit Room 1
- 18819 Ludlum Ave
- 18811 Ludlum Ave
- 104-22 189th St
- 10422 189th St
- 18807 Ludlum Ave
- 10420 189th St
- 10427 188th St
- 10419 188th St
- 10416 189th St
- 18816 Ludlum Ave
- 18816 Ludlum Ave
- 18820 Ludlum Ave
- 18812 Ludlum Ave
- 189-02 Ludlum Ave
- 188-12 Ludlum Ave
- 10415 188th St