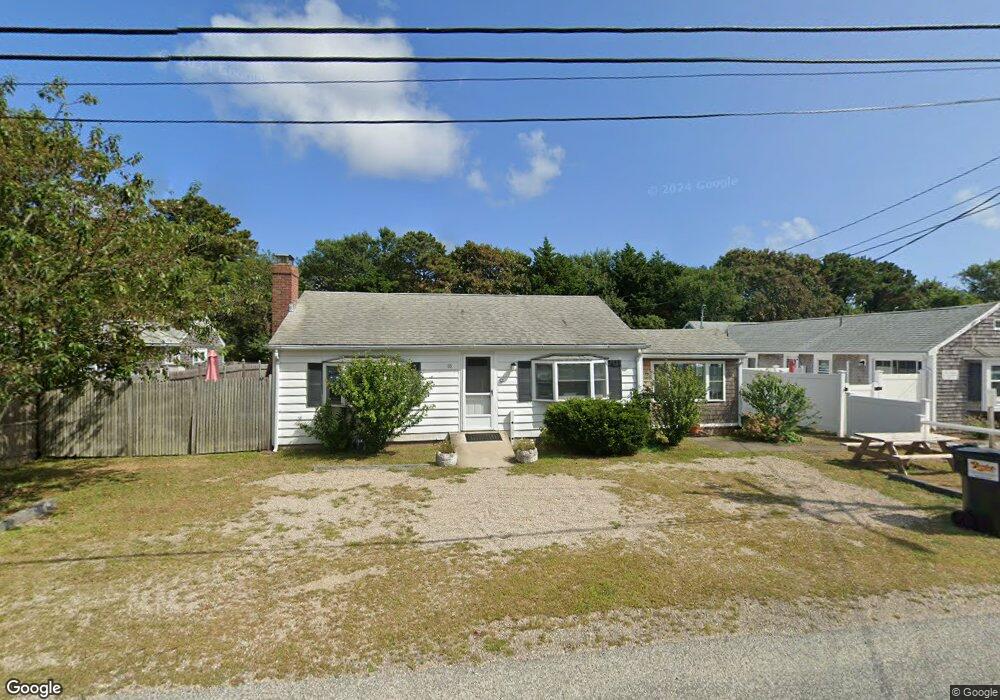
188-200 Capt Chase Rd (Delray) Dennis, MA 02639
Dennis Port NeighborhoodEstimated Value: $578,000 - $768,000
19
Beds
28
Baths
7,500
Sq Ft
$91/Sq Ft
Est. Value
About This Home
This home is located at 188-200 Capt Chase Rd (Delray), Dennis, MA 02639 and is currently estimated at $681,762, approximately $90 per square foot. 188-200 Capt Chase Rd (Delray) is a home located in Barnstable County with nearby schools including Dennis-Yarmouth Regional High School and St. Pius X. School.
Ownership History
Date
Name
Owned For
Owner Type
Purchase Details
Closed on
Oct 1, 2020
Sold by
Crawley Scott R and Crawley Dana M
Bought by
Crawley Scott R
Current Estimated Value
Purchase Details
Closed on
Aug 1, 2013
Sold by
Bendib Khalil M and Chin-Bendib Song N
Bought by
Crawley Scott R and Crawley Dana M
Purchase Details
Closed on
Jan 15, 2010
Sold by
Bahery Michele A
Bought by
Bendib Khalil M and Chin-Bendib Song N
Home Financials for this Owner
Home Financials are based on the most recent Mortgage that was taken out on this home.
Original Mortgage
$276,000
Interest Rate
4.71%
Mortgage Type
Purchase Money Mortgage
Create a Home Valuation Report for This Property
The Home Valuation Report is an in-depth analysis detailing your home's value as well as a comparison with similar homes in the area
Home Values in the Area
Average Home Value in this Area
Purchase History
| Date | Buyer | Sale Price | Title Company |
|---|---|---|---|
| Crawley Scott R | -- | None Available | |
| Crawley Scott R | $340,000 | -- | |
| Crawley Scott R | $340,000 | -- | |
| Crawley Scott R | $340,000 | -- | |
| Bendib Khalil M | $345,000 | -- | |
| Bendib Khalil M | $345,000 | -- |
Source: Public Records
Mortgage History
| Date | Status | Borrower | Loan Amount |
|---|---|---|---|
| Previous Owner | Bendib Khalil M | $276,000 | |
| Closed | Crawley Scott R | $0 |
Source: Public Records
Tax History Compared to Growth
Tax History
| Year | Tax Paid | Tax Assessment Tax Assessment Total Assessment is a certain percentage of the fair market value that is determined by local assessors to be the total taxable value of land and additions on the property. | Land | Improvement |
|---|---|---|---|---|
| 2025 | $2,721 | $628,300 | $310,500 | $317,800 |
| 2024 | $2,600 | $592,200 | $298,600 | $293,600 |
| 2023 | $2,518 | $539,200 | $271,500 | $267,700 |
| 2022 | $2,549 | $455,100 | $255,900 | $199,200 |
| 2021 | $2,518 | $417,600 | $250,900 | $166,700 |
| 2020 | $2,629 | $431,000 | $278,800 | $152,200 |
| 2019 | $2,511 | $406,900 | $273,300 | $133,600 |
| 2018 | $2,155 | $339,900 | $218,600 | $121,300 |
| 2017 | $2,069 | $336,400 | $218,600 | $117,800 |
| 2016 | $2,040 | $312,400 | $213,400 | $99,000 |
| 2015 | $1,999 | $312,400 | $213,400 | $99,000 |
| 2014 | $2,038 | $321,000 | $208,200 | $112,800 |
Source: Public Records
Map
Nearby Homes
- 154 Old Wharf Rd Unit 26
- 154 Old Wharf Rd Unit 14
- 64 Beaten Rd
- 112 Old Wharf Rd Unit E4
- 112 Old Wharf Rd Unit E1
- 120 Old Wharf Rd Unit 11
- 37 Ocean Dr Unit 2
- 217 Old Wharf Rd Unit 64
- 241 Old Wharf Rd Unit 82
- 241 Old Wharf Rd Unit 127
- 241 Old Wharf Rd Unit 90
- 262 Old Wharf Rd Unit 67
- 262 Old Wharf Rd Unit 5
- 262 Old Wharf Rd Unit 5
- 262 Old Wharf Rd Unit 20
- 262 Old Wharf Rd Unit 87
- 37 Beach Hills Rd
- 37-A Beach Hills Rd
- 31 Easy St
- 80 Michaels Ave
- 191 Cap Chase Rd
- 191 Captain Chase Rd
- 191 Captain Chase Rd Unit 3
- 191 Captain Chase Rd Unit 1-2
- 189 Captain Chase Rd
- 194-264 Captain Chase Unit 12
- 188 Captain Chase Rd
- 184-189 Captain Chase Rd
- 76 Uncle Rolf Rd
- 197 Captain Chase Rd
- 78 Uncle Rolf Rd
- 5 Captain Chase Rd
- 5 Captain Chase Rd
- 183 Captain Chase Rd Unit A&B
- 183 Captain Chase Rd Unit 1-7
- 183 Captain Chase Rd
- 183 Captain Chase Rd Unit 8
- 183 Captain Chase Rd Unit 8&9
- 183 Captain Chase Rd Unit 1
- 183 Captain Chase Rd Unit 5