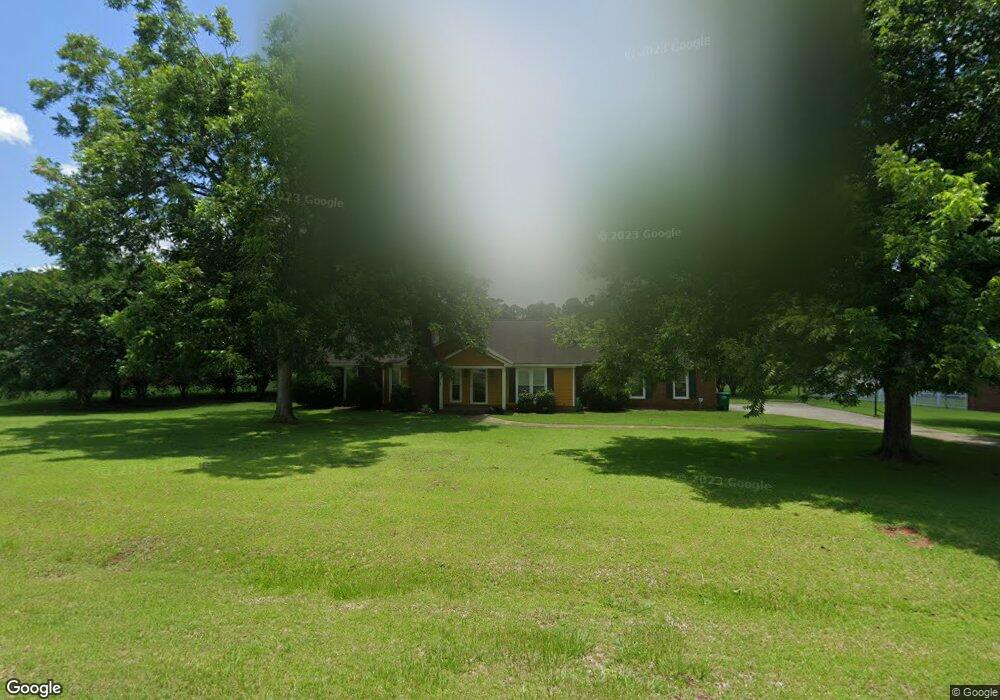
188 Berkeley Rd Albany, GA 31721
Estimated Value: $231,474 - $269,000
3
Beds
2
Baths
1,827
Sq Ft
$138/Sq Ft
Est. Value
About This Home
This home is located at 188 Berkeley Rd, Albany, GA 31721 and is currently estimated at $251,369, approximately $137 per square foot. 188 Berkeley Rd is a home located in Lee County with nearby schools including Lee County Primary School, Lee County Elementary School, and Lee County Middle School - West Campus.
Ownership History
Date
Name
Owned For
Owner Type
Purchase Details
Closed on
Sep 15, 2020
Sold by
Newell Richard A
Bought by
Russell Kimberly
Current Estimated Value
Home Financials for this Owner
Home Financials are based on the most recent Mortgage that was taken out on this home.
Original Mortgage
$164,957
Outstanding Balance
$144,379
Interest Rate
2.9%
Mortgage Type
FHA
Estimated Equity
$106,990
Purchase Details
Closed on
Oct 14, 2016
Sold by
Wendy S
Bought by
Newell Richard A and Newell Wendy S
Purchase Details
Closed on
Mar 8, 2007
Sold by
Newell Richard A
Bought by
Newell Wendy S
Purchase Details
Closed on
May 1, 2003
Sold by
Fowler James
Bought by
Newell Wendy S
Purchase Details
Closed on
Mar 24, 1998
Sold by
Thompson Kenneth Z
Bought by
Fowler James
Purchase Details
Closed on
Aug 9, 1996
Sold by
Reece Markle K
Bought by
Thompson Kenneth Z
Purchase Details
Closed on
Jan 1, 1996
Bought by
Reece Markle K
Create a Home Valuation Report for This Property
The Home Valuation Report is an in-depth analysis detailing your home's value as well as a comparison with similar homes in the area
Home Values in the Area
Average Home Value in this Area
Purchase History
| Date | Buyer | Sale Price | Title Company |
|---|---|---|---|
| Russell Kimberly | $168,000 | -- | |
| Newell Richard A | -- | -- | |
| Newell Wendy S | $140,000 | -- | |
| Newell Wendy S | -- | -- | |
| Fowler James | $108,500 | -- | |
| Thompson Kenneth Z | $108,500 | -- | |
| Reece Markle K | -- | -- |
Source: Public Records
Mortgage History
| Date | Status | Borrower | Loan Amount |
|---|---|---|---|
| Open | Russell Kimberly | $164,957 |
Source: Public Records
Tax History
| Year | Tax Paid | Tax Assessment Tax Assessment Total Assessment is a certain percentage of the fair market value that is determined by local assessors to be the total taxable value of land and additions on the property. | Land | Improvement |
|---|---|---|---|---|
| 2025 | $2,511 | $87,000 | $8,000 | $79,000 |
| 2024 | $1,897 | $62,800 | $8,000 | $54,800 |
| 2023 | $1,770 | $62,800 | $8,000 | $54,800 |
| 2022 | $1,770 | $62,800 | $8,000 | $54,800 |
| 2021 | $1,773 | $62,800 | $8,000 | $54,800 |
| 2020 | $1,573 | $49,480 | $8,040 | $41,440 |
| 2019 | $1,602 | $49,480 | $8,040 | $41,440 |
| 2018 | $1,602 | $49,480 | $8,040 | $41,440 |
| 2017 | $1,516 | $49,480 | $8,040 | $41,440 |
| 2016 | $1,516 | $49,480 | $8,040 | $41,440 |
| 2015 | $1,595 | $51,680 | $8,400 | $43,280 |
| 2014 | $1,324 | $43,080 | $7,000 | $36,080 |
| 2013 | -- | $43,080 | $7,000 | $36,080 |
Source: Public Records
Map
Nearby Homes
- 112 Berkeley Rd
- 2713 Westmeade Rd
- N/A N Doublegate Dr
- 2806 N Doublegate Dr
- 245 N Doublegate Dr
- 2705 Brittany Rd
- 2819 N Doublegate Dr
- 2707 Somerset Dr
- LOT 14 Make Ct
- 2710 Shannon Rd
- 3803 Gateway Ave
- Lot 12 Make Ct
- LOT 13 Make Ct
- 2607 Lansing Dr
- 2530 E Alberson Dr
- 6 Joiner Dr
- 2720 Somerset Dr
- 280 W Doublegate Dr
- 137 Joiner Dr
- 8 Joiner Dr
- 200 Berkeley Rd
- 184 Berkeley Rd
- 228 Berkeley Rd
- 106 Aylesbury Place
- 155 Cambridge Rd
- 193 Berkeley Rd
- 189 Berkeley Rd
- 110 Aylesbury Place
- 102 Aylesbury Place
- 104 Warrington Rd
- 164 Cambridge Rd
- 168 Cambridge Rd
- 153 Cambridge Rd
- 203 Berkeley Rd
- 203 Berkeley Rd
- 111 Warrington Rd
- 112 Aylesbury Place
- 176 Cambridge Rd
- 207 Berkeley Rd
- 146 Hollister Dr
Your Personal Tour Guide
Ask me questions while you tour the home.