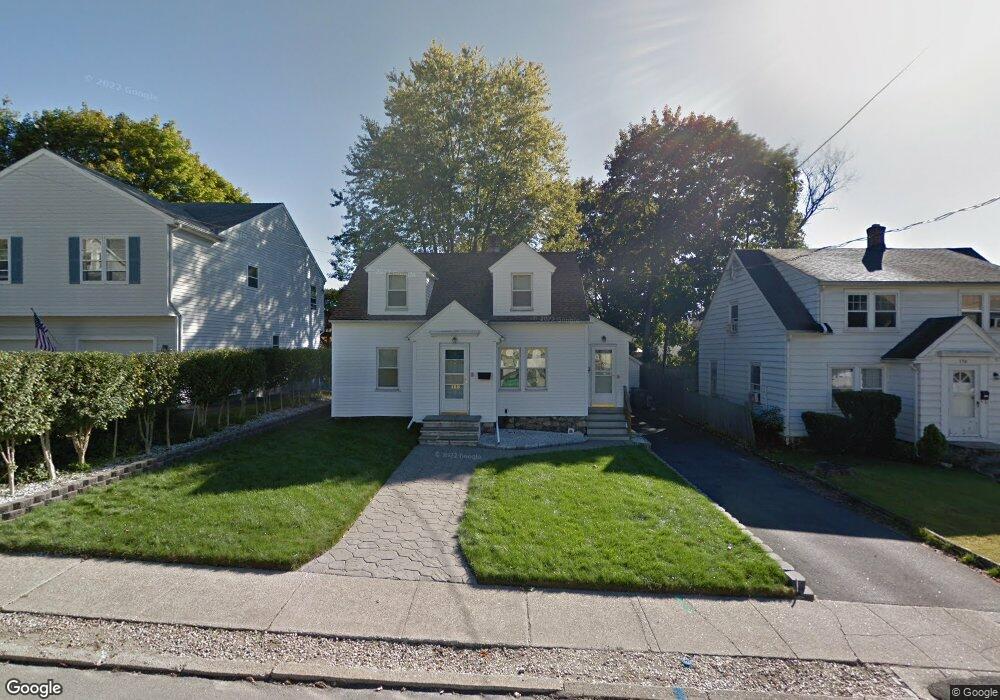
188 Gorman St Naugatuck, CT 06770
Estimated Value: $256,871 - $307,000
2
Beds
1
Bath
1,144
Sq Ft
$240/Sq Ft
Est. Value
About This Home
This home is located at 188 Gorman St, Naugatuck, CT 06770 and is currently estimated at $274,968, approximately $240 per square foot. 188 Gorman St is a home located in New Haven County with nearby schools including City Hill Middle School and Naugatuck High School.
Ownership History
Date
Name
Owned For
Owner Type
Purchase Details
Closed on
Jan 9, 2024
Sold by
Low Linda A
Bought by
Linda A Low T A and Linda Low
Current Estimated Value
Purchase Details
Closed on
Jan 10, 1997
Sold by
Rotatori Richard
Bought by
Low Linda
Home Financials for this Owner
Home Financials are based on the most recent Mortgage that was taken out on this home.
Original Mortgage
$89,700
Interest Rate
7.46%
Mortgage Type
Purchase Money Mortgage
Create a Home Valuation Report for This Property
The Home Valuation Report is an in-depth analysis detailing your home's value as well as a comparison with similar homes in the area
Home Values in the Area
Average Home Value in this Area
Purchase History
| Date | Buyer | Sale Price | Title Company |
|---|---|---|---|
| Linda A Low T A | -- | None Available | |
| Low Linda | $92,500 | -- |
Source: Public Records
Mortgage History
| Date | Status | Borrower | Loan Amount |
|---|---|---|---|
| Previous Owner | Low Linda | $10,000 | |
| Previous Owner | Low Linda | $89,200 | |
| Previous Owner | Low Linda | $89,700 |
Source: Public Records
Tax History Compared to Growth
Tax History
| Year | Tax Paid | Tax Assessment Tax Assessment Total Assessment is a certain percentage of the fair market value that is determined by local assessors to be the total taxable value of land and additions on the property. | Land | Improvement |
|---|---|---|---|---|
| 2025 | $5,239 | $131,670 | $25,760 | $105,910 |
| 2024 | $5,502 | $131,670 | $25,760 | $105,910 |
| 2023 | $5,892 | $131,670 | $25,760 | $105,910 |
| 2022 | $4,458 | $93,360 | $27,690 | $65,670 |
| 2021 | $4,458 | $93,360 | $27,690 | $65,670 |
| 2020 | $4,458 | $93,360 | $27,690 | $65,670 |
| 2019 | $4,411 | $93,360 | $27,690 | $65,670 |
| 2018 | $3,839 | $79,400 | $33,320 | $46,080 |
| 2017 | $3,855 | $79,400 | $33,320 | $46,080 |
| 2016 | $3,785 | $79,400 | $33,320 | $46,080 |
| 2015 | $3,618 | $79,400 | $33,320 | $46,080 |
| 2014 | $3,578 | $79,400 | $33,320 | $46,080 |
| 2012 | $3,939 | $117,410 | $42,070 | $75,340 |
Source: Public Records
Map
Nearby Homes