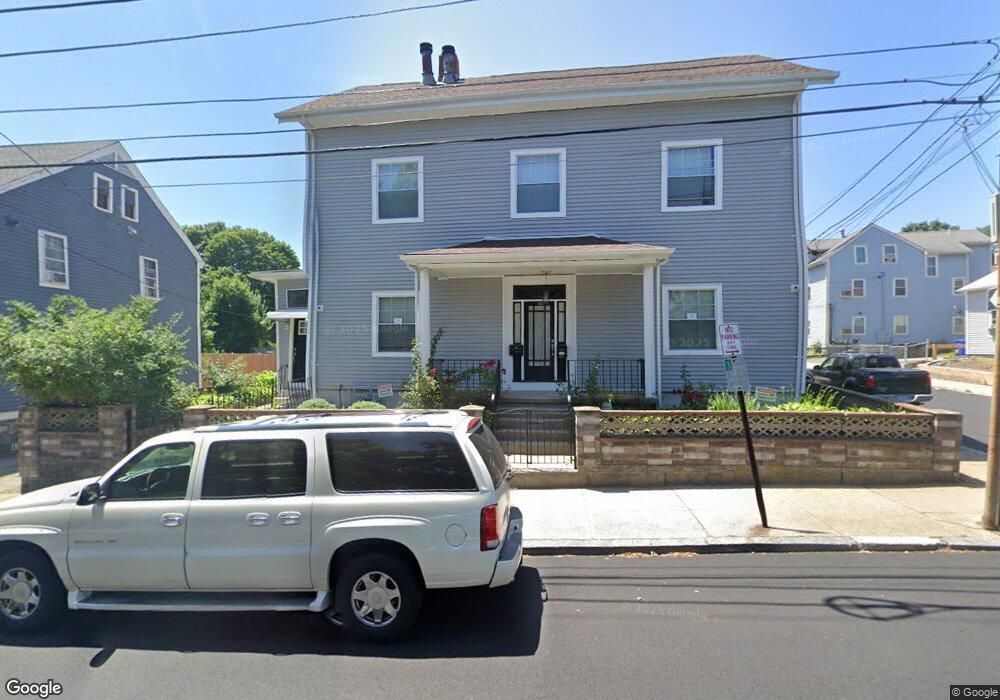
188 High St Pawtucket, RI 02860
Downtown Pawtucket NeighborhoodEstimated Value: $553,829 - $752,000
6
Beds
2
Baths
4,036
Sq Ft
$160/Sq Ft
Est. Value
About This Home
This home is located at 188 High St, Pawtucket, RI 02860 and is currently estimated at $644,707, approximately $159 per square foot. 188 High St is a home located in Providence County with nearby schools including International Charter School, Blackstone Academy Charter School, and Saint Raphael Academy.
Ownership History
Date
Name
Owned For
Owner Type
Purchase Details
Closed on
Jul 3, 2023
Sold by
Deburgo Artur C and Deburgo Elizia M
Bought by
Deburgo Ft and Deburgo
Current Estimated Value
Purchase Details
Closed on
May 12, 2010
Sold by
Deburgo Arthur C and Deburgo Elisia C
Bought by
Monteiro Deburgo Alberto and Monteiro-Deburgo Arthur J
Create a Home Valuation Report for This Property
The Home Valuation Report is an in-depth analysis detailing your home's value as well as a comparison with similar homes in the area
Home Values in the Area
Average Home Value in this Area
Purchase History
| Date | Buyer | Sale Price | Title Company |
|---|---|---|---|
| Deburgo Ft | -- | None Available | |
| Monteiro Deburgo Alberto | -- | -- |
Source: Public Records
Mortgage History
| Date | Status | Borrower | Loan Amount |
|---|---|---|---|
| Previous Owner | Monteiro Deburgo Alberto | $50,000 | |
| Previous Owner | Monteiro Deburgo Alberto | $140,800 | |
| Previous Owner | Monteiro Deburgo Alberto | $65,000 |
Source: Public Records
Tax History
| Year | Tax Paid | Tax Assessment Tax Assessment Total Assessment is a certain percentage of the fair market value that is determined by local assessors to be the total taxable value of land and additions on the property. | Land | Improvement |
|---|---|---|---|---|
| 2025 | $7,281 | $553,700 | $87,000 | $466,700 |
| 2024 | $6,833 | $553,700 | $87,000 | $466,700 |
| 2023 | $6,214 | $366,800 | $38,000 | $328,800 |
| 2022 | $6,082 | $366,800 | $38,000 | $328,800 |
| 2021 | $6,082 | $366,800 | $38,000 | $328,800 |
| 2020 | $5,515 | $264,000 | $47,500 | $216,500 |
| 2019 | $5,515 | $264,000 | $47,500 | $216,500 |
| 2018 | $5,314 | $264,000 | $47,500 | $216,500 |
| 2017 | $4,864 | $214,100 | $41,300 | $172,800 |
| 2016 | $4,687 | $214,100 | $41,300 | $172,800 |
| 2015 | $4,687 | $214,100 | $41,300 | $172,800 |
| 2014 | $4,582 | $198,700 | $41,300 | $157,400 |
Source: Public Records
Map
Nearby Homes
- 256 High St
- 88 Barton St
- 78 Barton St
- 84 Barton St
- 396 Roosevelt Ave
- 140 Dexter St
- 28 Bayley St Unit 107
- 28 Bayley St Unit 301
- 36 Underwood St
- 234 Central St Unit 236
- 23 Spring St
- 511 High St
- 517 High St
- 300 Front St Unit 105
- 300 Front St Unit 409
- 95 Park Place Unit 201
- 133 Cottage St
- 35 Laurel St
- 48 Kossuth St
- 153 Central Ave
- 178 High St
- 8 Grant St
- 182 High St
- 200 High St
- 170 High St
- 10 Grant St
- 221 High St
- 204 High St
- 9 Grant St
- 69 Montgomery St
- 75 Montgomery St
- 81 Montgomery St
- 49 Montgomery St
- 47 Montgomery St Unit 1F
- 47 Montgomery St Unit 1M
- 47 Montgomery St Unit 3
- 72 Exchange St
- 228 High St
- 84 Montgomery St
- 232 High St
Your Personal Tour Guide
Ask me questions while you tour the home.