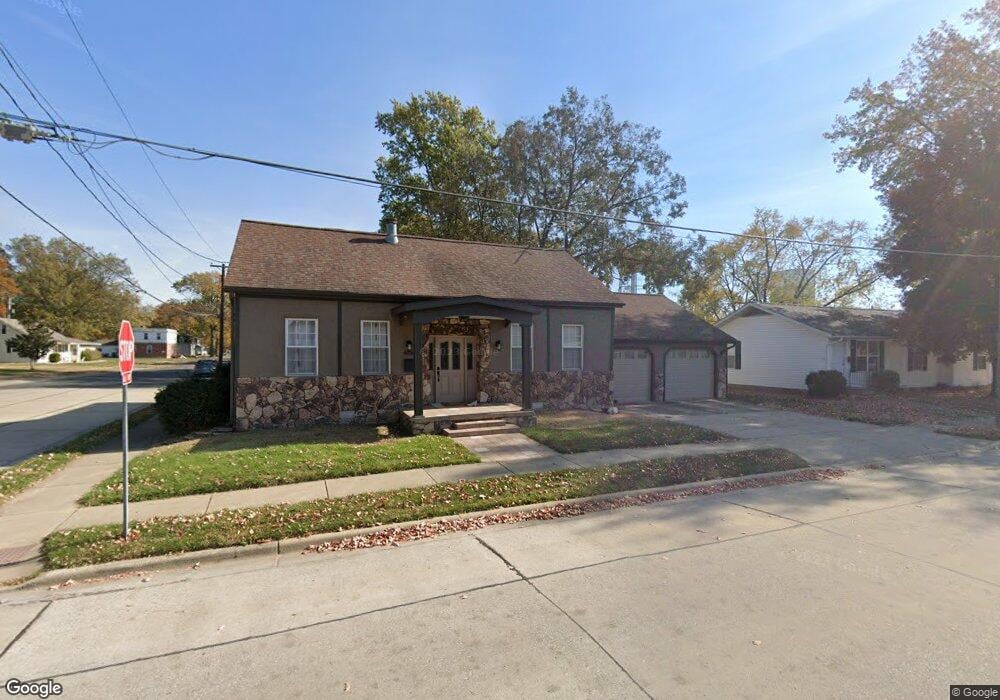
188 N Walnut St Breese, IL 62230
Estimated Value: $89,000 - $141,000
4
Beds
3
Baths
2,297
Sq Ft
$45/Sq Ft
Est. Value
About This Home
This home is located at 188 N Walnut St, Breese, IL 62230 and is currently estimated at $103,674, approximately $45 per square foot. 188 N Walnut St is a home located in Clinton County with nearby schools including Breese ESD #12, Beckemeyer Elementary School, and Central Community High School.
Ownership History
Date
Name
Owned For
Owner Type
Purchase Details
Closed on
Oct 31, 2025
Sold by
Rolfingsmeyer Edward J and Rolfingsmeyer Donna J
Bought by
Jansen Jared J and Jansen Chad R
Current Estimated Value
Home Financials for this Owner
Home Financials are based on the most recent Mortgage that was taken out on this home.
Original Mortgage
$113,600
Outstanding Balance
$113,600
Interest Rate
6.26%
Mortgage Type
New Conventional
Estimated Equity
-$9,926
Create a Home Valuation Report for This Property
The Home Valuation Report is an in-depth analysis detailing your home's value as well as a comparison with similar homes in the area
Home Values in the Area
Average Home Value in this Area
Purchase History
| Date | Buyer | Sale Price | Title Company |
|---|---|---|---|
| Jansen Jared J | $142,000 | None Available |
Source: Public Records
Mortgage History
| Date | Status | Borrower | Loan Amount |
|---|---|---|---|
| Open | Jansen Jared J | $113,600 |
Source: Public Records
Tax History
| Year | Tax Paid | Tax Assessment Tax Assessment Total Assessment is a certain percentage of the fair market value that is determined by local assessors to be the total taxable value of land and additions on the property. | Land | Improvement |
|---|---|---|---|---|
| 2024 | $1,531 | $22,270 | $4,190 | $18,080 |
| 2023 | $1,531 | $21,010 | $3,950 | $17,060 |
| 2022 | $1,525 | $19,100 | $3,590 | $15,510 |
| 2021 | $1,394 | $18,190 | $3,420 | $14,770 |
| 2020 | $1,370 | $17,490 | $3,290 | $14,200 |
| 2019 | $1,350 | $17,490 | $3,290 | $14,200 |
| 2018 | $1,425 | $17,524 | $3,370 | $14,154 |
| 2017 | $1,387 | $16,850 | $3,240 | $13,610 |
| 2016 | $1,380 | $16,850 | $3,240 | $13,610 |
| 2015 | $1,189 | $16,850 | $3,240 | $13,610 |
| 2013 | $1,189 | $16,880 | $3,240 | $13,640 |
Source: Public Records
Map
Nearby Homes
- 889 N 1st St
- 210 N Elm St
- 1031 N 1st St
- 534 S 2nd St
- 265 N 1st St
- 320 N Oak St
- 655 N 8th St
- 654 S 7th St
- 1059 N Cherry St
- 129 Jefferson Dr
- 1251 Sunset Dr
- 13964 Best One Dr
- 9953 President Ct
- 10675 Buckingham Ct
- 887 W 3rd St
- 4650 Wyatt Way
- 16328 Stolletown Rd
- xxxx Main St
- 708 Carlyle Rd
- 1102 Cherry St
Your Personal Tour Guide
Ask me questions while you tour the home.