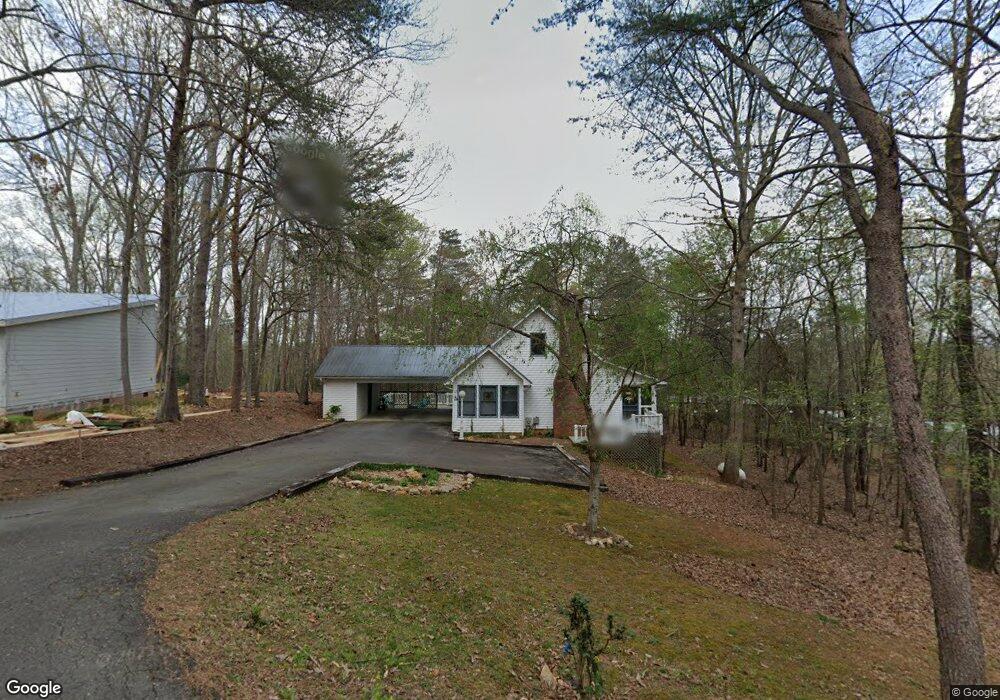
188 Rimcrest Dr Unit LOT 5510 Ellijay, GA 30540
Estimated Value: $337,869 - $446,000
3
Beds
2
Baths
1,854
Sq Ft
$202/Sq Ft
Est. Value
About This Home
This home is located at 188 Rimcrest Dr Unit LOT 5510, Ellijay, GA 30540 and is currently estimated at $375,217, approximately $202 per square foot. 188 Rimcrest Dr Unit LOT 5510 is a home located in Gilmer County with nearby schools including Ellijay Elementary School, Clear Creek Elementary School, and Clear Creek Middle School.
Ownership History
Date
Name
Owned For
Owner Type
Purchase Details
Closed on
Apr 8, 2016
Sold by
Clrak Charlotte J
Bought by
Clark Herman and Clark Charlotte
Current Estimated Value
Home Financials for this Owner
Home Financials are based on the most recent Mortgage that was taken out on this home.
Original Mortgage
$117,000
Outstanding Balance
$92,444
Interest Rate
3.68%
Mortgage Type
New Conventional
Estimated Equity
$282,773
Purchase Details
Closed on
Mar 7, 2007
Sold by
Citifinancial Svcs Inc
Bought by
Clark Charlotte J
Purchase Details
Closed on
Apr 4, 2006
Sold by
Butts Brent R
Bought by
Citifinancial Svcs Inc
Purchase Details
Closed on
Aug 1, 1991
Bought by
Butts Brent R
Purchase Details
Closed on
Sep 1, 1988
Bought by
Butts Brent R
Purchase Details
Closed on
Jan 1, 1982
Bought by
Butts Brent R
Purchase Details
Closed on
Jul 1, 1980
Bought by
Butts Brent R
Create a Home Valuation Report for This Property
The Home Valuation Report is an in-depth analysis detailing your home's value as well as a comparison with similar homes in the area
Home Values in the Area
Average Home Value in this Area
Purchase History
| Date | Buyer | Sale Price | Title Company |
|---|---|---|---|
| Clark Herman | -- | -- | |
| Clark Herman | -- | -- | |
| Clark Charlotte J | $142,500 | -- | |
| Clark Charlotte J | $142,500 | -- | |
| Citifinancial Svcs Inc | $125,900 | -- | |
| Citifinancial Svcs Inc | $125,900 | -- | |
| Butts Brent R | -- | -- | |
| Butts Brent R | -- | -- | |
| Butts Brent R | -- | -- | |
| Butts Brent R | -- | -- | |
| Butts Brent R | -- | -- | |
| Butts Brent R | -- | -- | |
| Butts Brent R | -- | -- | |
| Butts Brent R | -- | -- |
Source: Public Records
Mortgage History
| Date | Status | Borrower | Loan Amount |
|---|---|---|---|
| Open | Clark Herman | $117,000 |
Source: Public Records
Tax History Compared to Growth
Tax History
| Year | Tax Paid | Tax Assessment Tax Assessment Total Assessment is a certain percentage of the fair market value that is determined by local assessors to be the total taxable value of land and additions on the property. | Land | Improvement |
|---|---|---|---|---|
| 2024 | $1,813 | $117,000 | $3,400 | $113,600 |
| 2023 | $1,715 | $107,200 | $2,920 | $104,280 |
| 2022 | $1,611 | $91,520 | $2,000 | $89,520 |
| 2021 | $1,475 | $74,320 | $2,000 | $72,320 |
| 2020 | $1,424 | $64,760 | $1,920 | $62,840 |
| 2019 | $1,461 | $64,520 | $1,680 | $62,840 |
| 2018 | $1,419 | $61,840 | $1,680 | $60,160 |
| 2017 | $1,318 | $53,560 | $2,000 | $51,560 |
| 2016 | $1,379 | $54,920 | $2,000 | $52,920 |
| 2015 | $1,112 | $45,120 | $1,800 | $43,320 |
| 2014 | $1,067 | $41,640 | $1,800 | $39,840 |
| 2013 | -- | $41,920 | $1,800 | $40,120 |
Source: Public Records
Map
Nearby Homes
- 188 Foxhound Dr Unit 13
- 188 Foxhound Dr
- Lot 164, Foxhound Dr
- 685 Riverview Dr
- 685 Riverview Dr Unit 487
- LOT 478 Navaho Way
- 98 Forest Ct Unit 656
- 98 Forest Ct
- 366 Spindrift Ct
- 0 Mohawk Trail Unit 406863
- 149 Pinecrest Ct
- Lot 72 Huron Cir
- Lot 72 Huron Cir Unit 72
- 171 Mohawk Trail
- 145 Rockingham Way
- 264 Riverview Dr
- 298 Spindrift Ct
- 160 Primrose Ct
- LT 99R Ponca Ct
- LT 102R Ponca Ct
- 188 Rimcrest Dr
- 194 Rimcrest Dr
- 910 Riverview Dr
- LT506 Rimcrest Dr
- 510 Rimcrest Dr Unit LOT 510
- 127 Forestry Hills Dr
- 880 Riverview Dr
- 1AC Spindrift Ct Unit Lot 141
- 1AC Spindrift Ct
- 0 Arbor Ct Unit 544 7106018
- 0 Arbor Ct Unit 118686
- 0 Spindrift Ct Unit 121-2 8279385
- 0 Spindrift Ct Unit 121 3180195
- 0 Spindrift Ct Unit 119 7173699
- 0 Spindrift Ct
- 0 Spindrift Ct Unit 7100323
- 0 Spindrift Ct Unit 8365881
- 0 Spindrift Ct Unit 310304
- 15 Arbor Ct
- 218 Riverview Dr