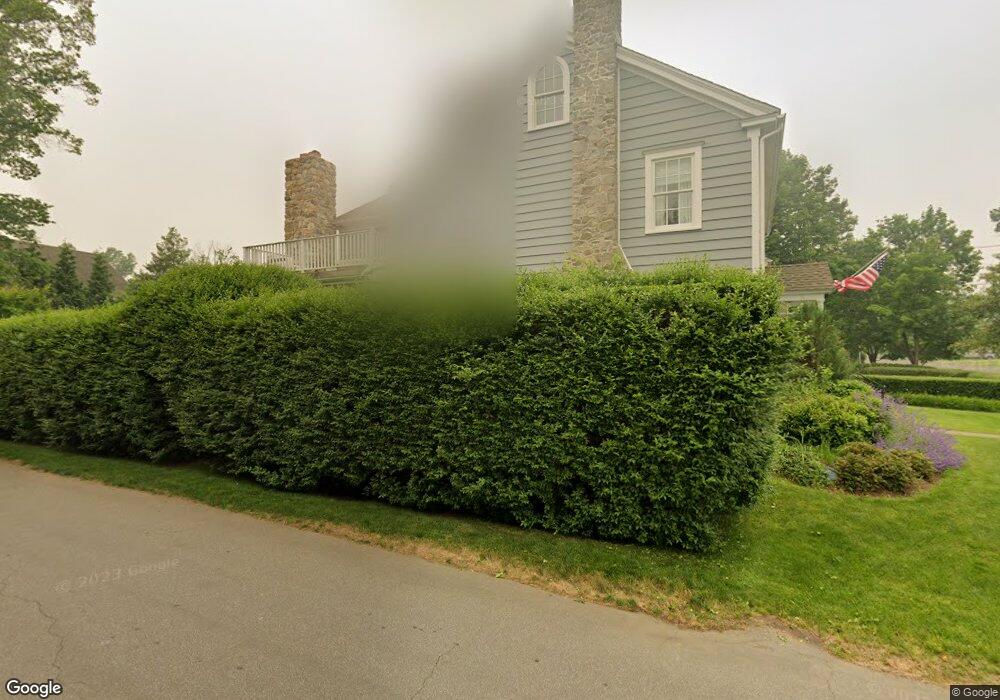
188 Rowland Rd Fairfield, CT 06824
Fairfield Beach NeighborhoodEstimated Value: $1,572,935 - $2,424,000
4
Beds
3
Baths
2,374
Sq Ft
$837/Sq Ft
Est. Value
About This Home
This home is located at 188 Rowland Rd, Fairfield, CT 06824 and is currently estimated at $1,986,484, approximately $836 per square foot. 188 Rowland Rd is a home located in Fairfield County with nearby schools including Roger Sherman Elementary School, Roger Ludlowe Middle School, and Fairfield Ludlowe High School.
Ownership History
Date
Name
Owned For
Owner Type
Purchase Details
Closed on
Dec 7, 2020
Sold by
Shanley Timothy K
Bought by
Young Ryan and Young Mallory
Current Estimated Value
Home Financials for this Owner
Home Financials are based on the most recent Mortgage that was taken out on this home.
Original Mortgage
$1,200,000
Outstanding Balance
$1,068,358
Interest Rate
2.7%
Mortgage Type
Purchase Money Mortgage
Estimated Equity
$918,126
Purchase Details
Closed on
Jun 24, 2011
Sold by
Carol Lyman Joyce
Bought by
Shanley Timothy K
Home Financials for this Owner
Home Financials are based on the most recent Mortgage that was taken out on this home.
Original Mortgage
$940,000
Interest Rate
4.63%
Purchase Details
Closed on
Jun 21, 1988
Sold by
Larsen Judith Y
Bought by
Lyman Gregroy K
Create a Home Valuation Report for This Property
The Home Valuation Report is an in-depth analysis detailing your home's value as well as a comparison with similar homes in the area
Home Values in the Area
Average Home Value in this Area
Purchase History
| Date | Buyer | Sale Price | Title Company |
|---|---|---|---|
| Young Ryan | $1,500,000 | None Available | |
| Young Ryan | $1,500,000 | None Available | |
| Shanley Timothy K | $942,500 | -- | |
| Shanley Timothy K | $942,500 | -- | |
| Lyman Gregroy K | $288,000 | -- |
Source: Public Records
Mortgage History
| Date | Status | Borrower | Loan Amount |
|---|---|---|---|
| Open | Young Ryan | $1,200,000 | |
| Closed | Young Ryan | $1,200,000 | |
| Previous Owner | Lyman Gregroy K | $840,000 | |
| Previous Owner | Lyman Gregroy K | $940,000 |
Source: Public Records
Tax History
| Year | Tax Paid | Tax Assessment Tax Assessment Total Assessment is a certain percentage of the fair market value that is determined by local assessors to be the total taxable value of land and additions on the property. | Land | Improvement |
|---|---|---|---|---|
| 2025 | $15,881 | $559,370 | $301,280 | $258,090 |
| 2024 | $15,606 | $559,370 | $301,280 | $258,090 |
| 2023 | $15,388 | $559,370 | $301,280 | $258,090 |
| 2022 | $15,237 | $559,370 | $301,280 | $258,090 |
| 2021 | $15,092 | $559,370 | $301,280 | $258,090 |
| 2020 | $16,478 | $615,090 | $315,910 | $299,180 |
| 2019 | $16,478 | $615,090 | $315,910 | $299,180 |
| 2018 | $16,214 | $615,090 | $315,910 | $299,180 |
| 2017 | $15,882 | $615,090 | $315,910 | $299,180 |
| 2016 | $15,654 | $615,090 | $315,910 | $299,180 |
| 2015 | $14,377 | $579,950 | $352,800 | $227,150 |
| 2014 | $14,151 | $579,950 | $352,800 | $227,150 |
Source: Public Records
Map
Nearby Homes
- 345 Reef Rd Unit B6
- 345 Reef Rd Unit C9
- 126 Lalley Blvd
- 510 Reef Rd
- 187 Catherine Terrace
- 378 Penfield Rd
- 394 Penfield Rd
- 88 Veres St
- 110 Pratt St
- 783 Reef Rd
- 127 Paul Place
- 110 Alden St
- 28 Michaela Cir
- 464 Ruane St
- 245 Unquowa Rd Unit 82
- 65 Thorpe St Unit 65
- 855 Riverside Dr
- 25 Helen St
- 598 S Benson Rd
- 1008 Fairfield Beach Rd
Your Personal Tour Guide
Ask me questions while you tour the home.