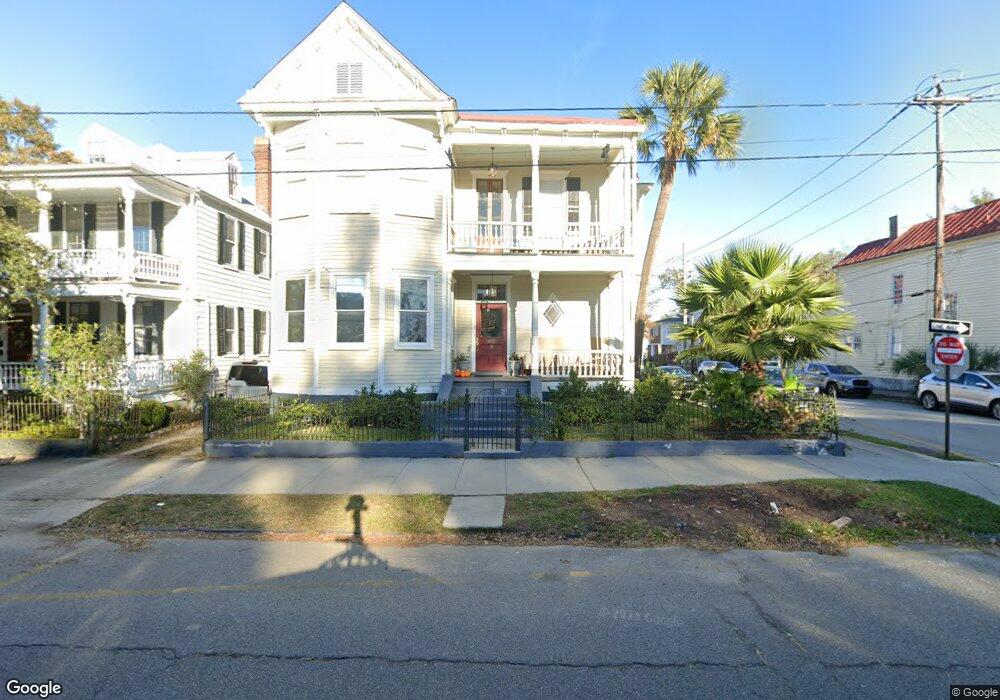
188 Rutledge Ave Unit A Charleston, SC 29403
Cannonborough-Elliotborough NeighborhoodEstimated Value: $1,425,000 - $2,775,964
4
Beds
1
Bath
1,400
Sq Ft
$1,537/Sq Ft
Est. Value
About This Home
This home is located at 188 Rutledge Ave Unit A, Charleston, SC 29403 and is currently estimated at $2,152,491, approximately $1,537 per square foot. 188 Rutledge Ave Unit A is a home located in Charleston County with nearby schools including Memminger Elementary School, Simmons Pinckney Middle, and Burke High School.
Ownership History
Date
Name
Owned For
Owner Type
Purchase Details
Closed on
Jul 19, 2023
Sold by
M & M Greenwood Llc
Bought by
Gaines Irish Mary and Gaines Stephen Smith
Current Estimated Value
Home Financials for this Owner
Home Financials are based on the most recent Mortgage that was taken out on this home.
Original Mortgage
$171,500
Interest Rate
6.67%
Mortgage Type
New Conventional
Purchase Details
Closed on
Sep 30, 2021
Sold by
Chakeris John T
Bought by
M & M Greenwood Llc
Purchase Details
Closed on
Aug 13, 2015
Sold by
Calhoun Street Investment Company Llc
Bought by
Chakeris John T
Purchase Details
Closed on
Sep 20, 2005
Sold by
Cravens Rhea
Bought by
Calhoun Street Investment Co Llc
Create a Home Valuation Report for This Property
The Home Valuation Report is an in-depth analysis detailing your home's value as well as a comparison with similar homes in the area
Home Values in the Area
Average Home Value in this Area
Purchase History
| Date | Buyer | Sale Price | Title Company |
|---|---|---|---|
| Gaines Irish Mary | $1,590,000 | South Carolina Title | |
| M & M Greenwood Llc | $840,000 | None Listed On Document | |
| Chakeris John T | -- | -- | |
| Calhoun Street Investment Co Llc | $700,000 | -- |
Source: Public Records
Mortgage History
| Date | Status | Borrower | Loan Amount |
|---|---|---|---|
| Closed | Gaines Irish Mary | $171,500 | |
| Open | Gaines Irish Mary | $1,272,000 |
Source: Public Records
Tax History Compared to Growth
Tax History
| Year | Tax Paid | Tax Assessment Tax Assessment Total Assessment is a certain percentage of the fair market value that is determined by local assessors to be the total taxable value of land and additions on the property. | Land | Improvement |
|---|---|---|---|---|
| 2024 | $11,900 | $69,960 | $0 | $0 |
| 2023 | $11,900 | $36,960 | $0 | $0 |
| 2022 | $13,449 | $50,400 | $0 | $0 |
| 2021 | $9,285 | $35,070 | $0 | $0 |
| 2020 | $9,217 | $35,070 | $0 | $0 |
| 2019 | $8,424 | $30,500 | $0 | $0 |
| 2017 | $8,048 | $30,500 | $0 | $0 |
| 2016 | $7,786 | $30,500 | $0 | $0 |
| 2015 | $7,433 | $30,500 | $0 | $0 |
| 2014 | $6,392 | $0 | $0 | $0 |
| 2011 | -- | $0 | $0 | $0 |
Source: Public Records
Map
Nearby Homes
- 94 Morris St Unit A, B, C, D
- 5 Oliver Ct
- 194 Rutledge Ave
- 188 Rutledge Ave
- 87 Cannon St
- 12 Bee St Unit C
- 192 Ashley Ave Unit C
- 184 Ashley Ave
- 64 Radcliffe St
- 221 Ashley Ave Unit Abc
- 134 Spring St
- 7 Doughty St Unit F
- 173 Coming St Unit B
- 190 Coming St
- 68 Vanderhorst St Unit A
- 68 Vanderhorst St Unit B
- 244 Ashley Ave
- 66 Warren St Unit Entire Property
- 66 Warren St
- 151 Spring St Unit A
- 188 Rutledge Ave Unit B
- 190 Rutledge Ave
- 100 Morris St
- 100 Morris St Unit A
- 186 Rutledge Ave
- 186 Rutledge Ave Unit A-E
- 192 Rutledge Ave
- 98 Morris St
- 184 Rutledge Ave Unit B
- 184 Rutledge Ave Unit A
- 96 Morris St
- 196 Rutledge Ave
- 196 Rutledge Ave Unit 2
- 196 Rutledge Ave Unit B
- 196 Rutledge Ave Unit D
- 196 Rutledge Ave Unit C
- 196 Rutledge Ave Unit A
- 97 Morris St
- 94 Morris St Unit D
- 94 Morris St Unit A