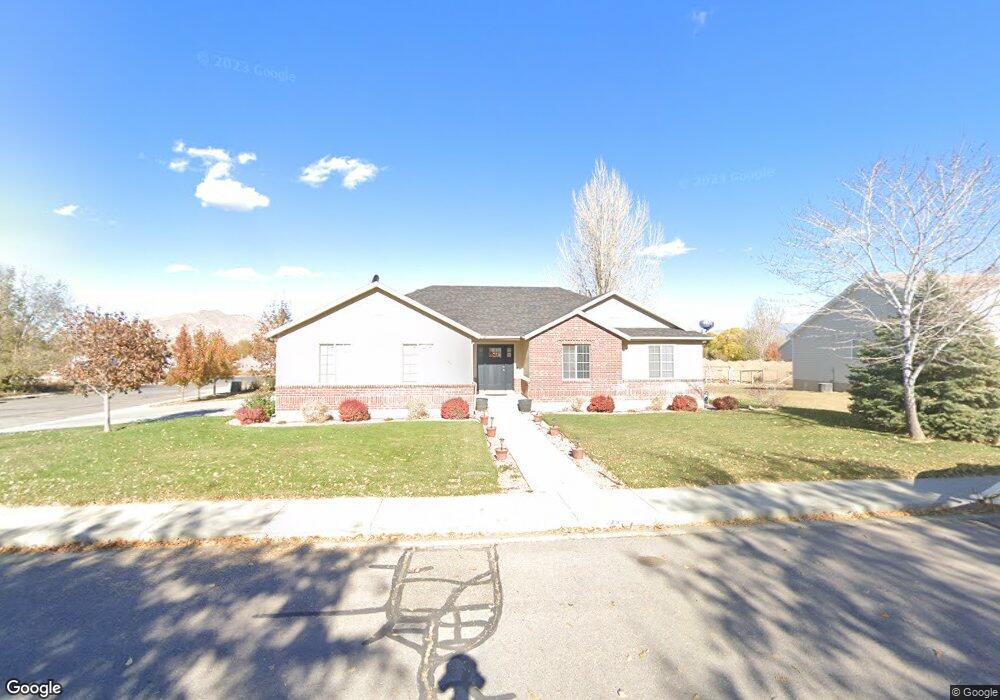
188 W 450 N Santaquin, UT 84655
Estimated Value: $506,000 - $562,000
5
Beds
3
Baths
3,153
Sq Ft
$169/Sq Ft
Est. Value
About This Home
This home is located at 188 W 450 N, Santaquin, UT 84655 and is currently estimated at $532,196, approximately $168 per square foot. 188 W 450 N is a home located in Utah County with nearby schools including Apple Valley Elementary, Payson Junior High School, and Payson High School.
Ownership History
Date
Name
Owned For
Owner Type
Purchase Details
Closed on
Oct 15, 2015
Sold by
Lindman Bingham Mary Joanne
Bought by
Bingham Warren William
Current Estimated Value
Purchase Details
Closed on
Jun 19, 2015
Sold by
Brown Diane
Bought by
Bingham Mary Joanne Lindman
Purchase Details
Closed on
Jun 21, 2005
Sold by
Anderson Ryan M and Anderson Shirona
Bought by
Lindman Wilford B
Purchase Details
Closed on
May 15, 2003
Sold by
Bastian Homes Inc
Bought by
Anderson Ryan M and Anderson Shirona
Home Financials for this Owner
Home Financials are based on the most recent Mortgage that was taken out on this home.
Original Mortgage
$167,632
Interest Rate
5.71%
Mortgage Type
FHA
Purchase Details
Closed on
Jan 14, 2003
Sold by
Nac Co Llc
Bought by
Bastian Homes Inc
Home Financials for this Owner
Home Financials are based on the most recent Mortgage that was taken out on this home.
Original Mortgage
$124,475
Interest Rate
6.15%
Create a Home Valuation Report for This Property
The Home Valuation Report is an in-depth analysis detailing your home's value as well as a comparison with similar homes in the area
Home Values in the Area
Average Home Value in this Area
Purchase History
| Date | Buyer | Sale Price | Title Company |
|---|---|---|---|
| Bingham Warren William | -- | None Available | |
| Bingham Mary Joanne Lindman | -- | None Available | |
| Lindman Wilford B | -- | First American Title Agency | |
| Anderson Ryan M | -- | Wasatch Land & Title Ins | |
| Bastian Homes Inc | -- | Wasatch Land & Title |
Source: Public Records
Mortgage History
| Date | Status | Borrower | Loan Amount |
|---|---|---|---|
| Previous Owner | Anderson Ryan M | $167,632 | |
| Previous Owner | Bastian Homes Inc | $124,475 |
Source: Public Records
Tax History Compared to Growth
Tax History
| Year | Tax Paid | Tax Assessment Tax Assessment Total Assessment is a certain percentage of the fair market value that is determined by local assessors to be the total taxable value of land and additions on the property. | Land | Improvement |
|---|---|---|---|---|
| 2025 | $2,422 | $272,690 | $146,800 | $349,000 |
| 2024 | $2,422 | $241,230 | $0 | $0 |
| 2023 | $2,482 | $247,995 | $0 | $0 |
| 2022 | $2,524 | $260,040 | $0 | $0 |
| 2021 | $2,179 | $348,000 | $82,800 | $265,200 |
| 2020 | $2,097 | $324,600 | $72,000 | $252,600 |
| 2019 | $1,937 | $306,600 | $72,000 | $234,600 |
| 2018 | $1,814 | $273,800 | $62,900 | $210,900 |
| 2017 | $1,684 | $135,795 | $0 | $0 |
| 2016 | $1,598 | $126,225 | $0 | $0 |
| 2015 | $1,419 | $109,945 | $0 | $0 |
| 2014 | $1,287 | $99,550 | $0 | $0 |
Source: Public Records
Map
Nearby Homes
- 600 N Center St
- 162 W 690 N
- 921 N 160 E
- 921 N 160 E Unit 12
- 931 N 160 E Unit 11
- 922 N 160 E Unit 20
- 932 N 160 E Unit 21
- 369 N 500 W Unit 3
- 41 W 770 N
- 348 N 200 E
- 43 N 300 W
- 923 N 200 E
- 933 N 200 E
- 933 N 200 E Unit 32
- Pendleton Plan at Silver Oaks
- 951 N 215 W
- 949 N 215 W
- 947 N 215 W
- 953 N 215 W
- 1700 Farmhouse Plan at Tanner Flats