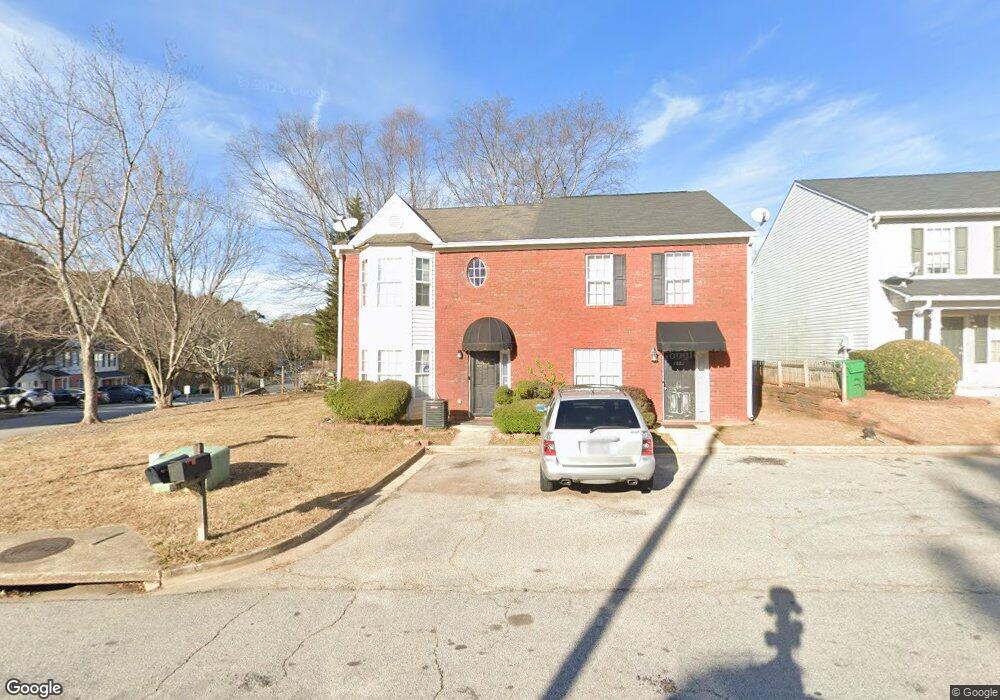
1880 Shawn Wayne Ct SE Atlanta, GA 30316
Parker NeighborhoodEstimated Value: $204,000 - $238,000
3
Beds
3
Baths
1,388
Sq Ft
$159/Sq Ft
Est. Value
About This Home
This home is located at 1880 Shawn Wayne Ct SE, Atlanta, GA 30316 and is currently estimated at $220,764, approximately $159 per square foot. 1880 Shawn Wayne Ct SE is a home located in DeKalb County with nearby schools including McNair Middle School, McNair High School, and Cambridge Academy.
Ownership History
Date
Name
Owned For
Owner Type
Purchase Details
Closed on
Oct 21, 2009
Sold by
Federal Home Loan Mortgage Corporation
Bought by
Healey Theresa
Current Estimated Value
Purchase Details
Closed on
Jun 2, 2009
Sold by
Suntrust Mortgage Inc
Bought by
Federal Home Loan Mortgage Corporation
Purchase Details
Closed on
Sep 11, 2006
Sold by
Deutsche Bk Trust Co Americas
Bought by
Ofili Gregory E
Home Financials for this Owner
Home Financials are based on the most recent Mortgage that was taken out on this home.
Original Mortgage
$67,250
Interest Rate
6.58%
Mortgage Type
New Conventional
Purchase Details
Closed on
Aug 3, 2004
Sold by
Driver Ernest K
Bought by
Deutsche Bk Trust Co
Purchase Details
Closed on
Dec 3, 2001
Sold by
Aaa Property Assoc Llc
Bought by
Aaa Property Assoc 1 Inc
Create a Home Valuation Report for This Property
The Home Valuation Report is an in-depth analysis detailing your home's value as well as a comparison with similar homes in the area
Home Values in the Area
Average Home Value in this Area
Purchase History
| Date | Buyer | Sale Price | Title Company |
|---|---|---|---|
| Healey Theresa | -- | -- | |
| Federal Home Loan Mortgage Corporation | -- | -- | |
| Suntrust Mtg Inc | $68,057 | -- | |
| Ofili Gregory E | $84,100 | -- | |
| Deutsche Bk Trust Co | $97,895 | -- | |
| Aaa Property Assoc 1 Inc | -- | -- |
Source: Public Records
Mortgage History
| Date | Status | Borrower | Loan Amount |
|---|---|---|---|
| Previous Owner | Ofili Gregory E | $67,250 |
Source: Public Records
Tax History Compared to Growth
Tax History
| Year | Tax Paid | Tax Assessment Tax Assessment Total Assessment is a certain percentage of the fair market value that is determined by local assessors to be the total taxable value of land and additions on the property. | Land | Improvement |
|---|---|---|---|---|
| 2024 | $4,434 | $91,800 | $20,000 | $71,800 |
| 2023 | $4,434 | $86,400 | $20,000 | $66,400 |
| 2022 | $3,162 | $64,920 | $8,000 | $56,920 |
| 2021 | $2,518 | $50,240 | $8,000 | $42,240 |
| 2020 | $2,311 | $45,520 | $8,000 | $37,520 |
| 2019 | $1,995 | $38,320 | $8,000 | $30,320 |
| 2018 | $1,634 | $33,360 | $5,520 | $27,840 |
| 2017 | $1,431 | $25,360 | $5,520 | $19,840 |
| 2016 | $1,280 | $21,880 | $5,520 | $16,360 |
| 2014 | $994 | $15,040 | $5,520 | $9,520 |
Source: Public Records
Map
Nearby Homes
- 2025 Shawn Wayne Cir SE
- 1856 Timberwood Trace
- 2263 Leicester Way SE
- 1937 Joseph Ct
- 2334 Second Ave Unit LAND
- 2213 Leicester Way SE
- 1956 Joseph Ct
- 1949 Capri Dr
- 1794 N Umberland Way SE
- 1902 Joseph Ct
- 2025 East Dr
- 1944 Capri Dr
- 2168 Somerset Place SE
- 2424 Flat Shoals Rd
- 1903 Valencia Rd Unit 1
- 2417 Castle Keep Way SE
- 2117 Somerset Place SE
- 2374 Woodcastle Ln SE
- 1880 Shawn Wayne Ct SE Unit NAVLB
- 1882 Shawn Wayne Ct SE
- 1884 Shawn Way Ct SE
- 1884 Shawn Wayne Ct SE
- 1919 Shawn Wayne Cir SE
- 1921 Shawn Wayne Cir SE Unit 1921
- 1921 Shawn Wayne Cir SE
- 1921 Shawn Wayne Cir SE
- 1923 Shawn Wayne Cir SE
- 1923 Shawn Wayne Cir SE
- 1886 Shawn Wayne Ct SE
- 1870 Shawn Wayne Ct SE
- 1925 Shawn Wayne Cir SE
- 1888 Shawn Wayne Ct SE
- 1868 Shawn Wayne Ct SE
- 1868 Shawn Wayne Ct SE Unit 1868
- 1927 Shawn Wayne Cir SE Unit 127
- 1927 Shawn Wayne Cir SE
- 1881 Shawn Wayne Ct SE
- 2033 Shawn Wayne Cir SE