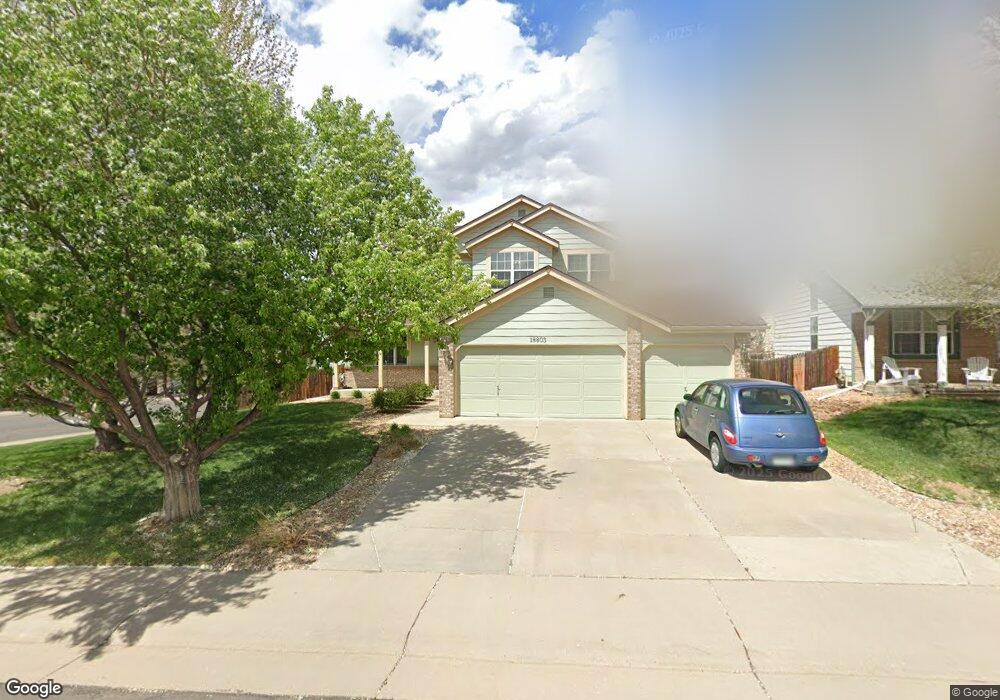
18803 E Union Place Aurora, CO 80015
Prides Crossing NeighborhoodEstimated Value: $582,000 - $641,000
3
Beds
4
Baths
2,528
Sq Ft
$240/Sq Ft
Est. Value
About This Home
This home is located at 18803 E Union Place, Aurora, CO 80015 and is currently estimated at $605,744, approximately $239 per square foot. 18803 E Union Place is a home located in Arapahoe County with nearby schools including Peakview Elementary School, Thunder Ridge Middle School, and Eaglecrest High School.
Ownership History
Date
Name
Owned For
Owner Type
Purchase Details
Closed on
Dec 30, 2019
Sold by
Robinson Daniel G and Robinson Elan D
Bought by
Robinson Daniel and Robinson Elan
Current Estimated Value
Purchase Details
Closed on
May 10, 1995
Sold by
Kdb Homes Inc
Bought by
Robinson Daniel G and Robinson Elan D
Home Financials for this Owner
Home Financials are based on the most recent Mortgage that was taken out on this home.
Original Mortgage
$192,700
Interest Rate
8.35%
Purchase Details
Closed on
Jan 17, 1991
Sold by
Conversion Arapco
Bought by
Syracuse Corp
Purchase Details
Closed on
Sep 14, 1987
Bought by
Conversion Arapco
Create a Home Valuation Report for This Property
The Home Valuation Report is an in-depth analysis detailing your home's value as well as a comparison with similar homes in the area
Home Values in the Area
Average Home Value in this Area
Purchase History
| Date | Buyer | Sale Price | Title Company |
|---|---|---|---|
| Robinson Daniel | -- | None Available | |
| Robinson Daniel G | $214,128 | -- | |
| Syracuse Corp | -- | -- | |
| Conversion Arapco | -- | -- |
Source: Public Records
Mortgage History
| Date | Status | Borrower | Loan Amount |
|---|---|---|---|
| Closed | Robinson Daniel G | $192,700 |
Source: Public Records
Tax History Compared to Growth
Tax History
| Year | Tax Paid | Tax Assessment Tax Assessment Total Assessment is a certain percentage of the fair market value that is determined by local assessors to be the total taxable value of land and additions on the property. | Land | Improvement |
|---|---|---|---|---|
| 2024 | $1,955 | $34,954 | -- | -- |
| 2023 | $1,955 | $34,954 | $0 | $0 |
| 2022 | $2,247 | $31,018 | $0 | $0 |
| 2021 | $2,261 | $31,018 | $0 | $0 |
| 2020 | $2,187 | $30,460 | $0 | $0 |
| 2019 | $2,110 | $30,460 | $0 | $0 |
| 2018 | $1,902 | $25,798 | $0 | $0 |
| 2017 | $1,875 | $25,798 | $0 | $0 |
| 2016 | $1,704 | $21,993 | $0 | $0 |
| 2015 | $1,622 | $21,993 | $0 | $0 |
| 2014 | $1,703 | $20,457 | $0 | $0 |
| 2013 | -- | $21,150 | $0 | $0 |
Source: Public Records
Map
Nearby Homes
- 4735 S Cathay Ct
- 4812 S Bahama Way
- 4731 S Danube Cir
- 4856 S Argonne St
- 4835 S Danube Way
- 4875 S Argonne St
- 4895 S Argonne St
- 19166 E Stanford Dr
- 4931 S Danube St
- 4820 S Zeno St
- 4934 S Danube St
- 4795 S Zeno St
- 4809 S Zeno St
- 19093 E Bellewood Dr
- 18538 E Whitaker Cir Unit E
- 18211 E Layton Place
- 5015 S Dunkirk Way
- 5026 S Dunkirk Way
- 4371 S Andes Way Unit 102
- 19115 E Belleview Place
- 18813 E Union Place
- 18836 E Union Dr
- 18823 E Union Place
- 18791 E Union Place
- 18804 E Union Place
- 18825 E Union Dr
- 18846 E Union Dr
- 18814 E Union Place
- 18835 E Union Dr
- 18833 E Union Place
- 18781 E Union Place
- 18824 E Union Place
- 18837 E Union Dr
- 18792 E Union Place
- 18856 E Union Dr
- 18845 E Union Dr
- 18834 E Union Place
- 18843 E Union Place
- 18782 E Union Place
- 18866 E Union Dr