1881 E 6825 N Liberty, UT 84310
Estimated Value: $1,406,000 - $1,645,383
About This Home
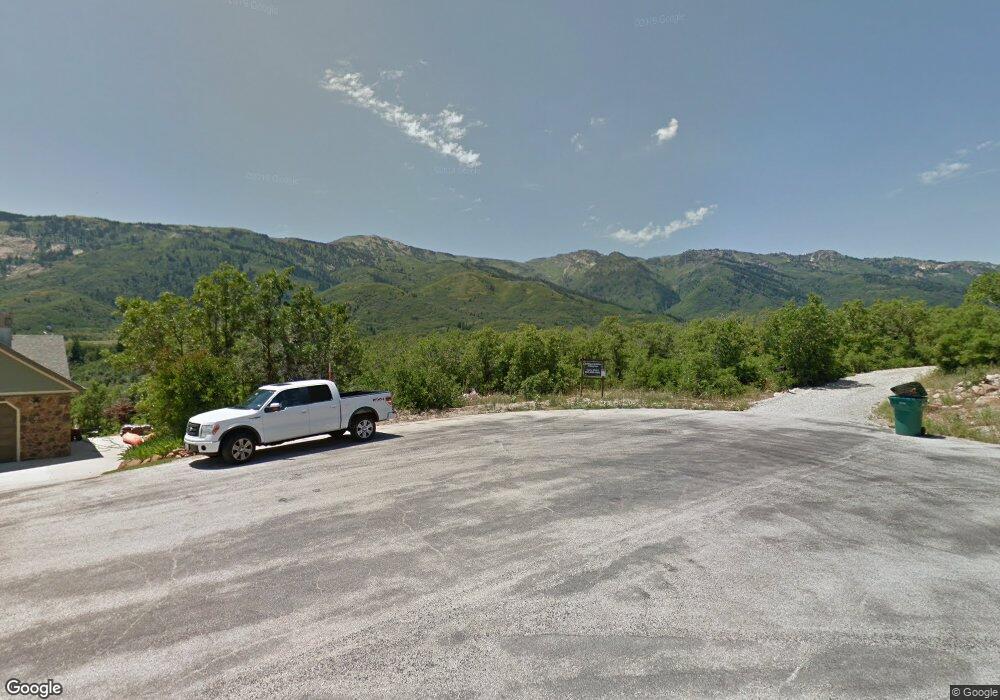
This home is located at 1881 E 6825 N, Liberty, UT 84310 and is currently estimated at $1,522,596, approximately $289 per square foot. 1881 E 6825 N is a home located in Weber County with nearby schools including Valley Elementary School, Snowcrest Junior High School, and Weber High School.
Ownership History
We collect this data history from publicly available records. To have your information removed, we recommend requesting removal directly through your county’s website.
Purchase Details
Home Financials for this Owner
Home Financials are based on the most recent Mortgage that was taken out on this home.Purchase Details
Purchase Details
Purchase Details
Purchase Details
Purchase History
We collect this data history from publicly available records. To have your information removed, we recommend requesting removal directly through your county’s website.
| Date | Buyer | Sale Price | Title Company |
|---|---|---|---|
| -- | First American Title | ||
| -- | First American Title | ||
| -- | Metro National Title | ||
| -- | None Available | ||
| -- | Executive Title |
Mortgage History
We collect this data history from publicly available records. To have your information removed, we recommend requesting removal directly through your county’s website.
| Date | Status | Borrower | Loan Amount |
|---|---|---|---|
| Open | $1,000,000 |
Tax History
We collect this data history from publicly available records. To have your information removed, we recommend requesting removal directly through your county’s website.
| Year | Tax Paid | Tax Assessment Tax Assessment Total Assessment is a certain percentage of the fair market value that is determined by local assessors to be the total taxable value of land and additions on the property. | Land | Improvement |
|---|---|---|---|---|
| 2025 | $7,027 | $1,315,121 | $236,527 | $1,078,594 |
| 2024 | $6,426 | $677,134 | $132,890 | $544,244 |
| 2023 | $6,912 | $719,223 | $126,421 | $592,802 |
| 2022 | $5,902 | $622,851 | $112,971 | $509,880 |
| 2021 | $4,597 | $817,000 | $134,518 | $682,482 |
| 2020 | $4,682 | $764,000 | $134,518 | $629,482 |
| 2019 | $4,370 | $682,000 | $134,518 | $547,482 |
| 2018 | $4,201 | $768,455 | $127,716 | $640,739 |
| 2017 | $4,578 | $669,480 | $117,700 | $551,780 |
| 2016 | $4,550 | $362,418 | $63,200 | $299,218 |
| 2015 | $3,493 | $321,736 | $63,200 | $258,536 |
| 2014 | $1,457 | $112,700 | $112,700 | $0 |
Map
- 6975 Durfee Way Unit 20
- 2276 E Lauren Ln Unit 10
- 2252 E Lauren Ln
- 1948 E 6225 N
- 2127 E 5950 N
- 6449 N North Fork Rd
- 3138 E 5300 N
- 3257 E 5300 N
- 5073 N 3300 E
- 4458 N 3150 E
- 4601 N 2900 E
- 3462 E 4100 N
- 4548 N Sheep Creek Dr
- 4068 N 3300 E
- 3440 E 4100 N
- 6746 E Aspen Dr Unit 38
- 4271 N Powder Mountain Rd E
- 1595 N Hardy Trail Rd Unit 2
- 4937 E Fairways Dr N
- 8526 E Overlook Dr
- 1881 E 6825 N Unit 6
- 1895 E 6825 N
- 1874 E 6825 N
- 1919 E 6825 N
- 1919 E 6825 N
- 6810 N Fork Rd Unit N
- 1888 E 6825 N
- 1867 E 6925 N
- 6756 N Fork Rd Unit N
- 6724 N Fork Rd
- 1926 E 6825 N Unit 9
- 1926 E 6825 N
- 1895 E 6925 N
- 1943 E 6825 N
- 1948 E 6825 N
- 6738 N Fork Rd Unit N
- 6722 N Fork Rd Unit N
- 1919 E 6925 N
- 1919 E 6925 N Unit 16
- 6716 N Fork Rd Unit N
Ask me questions while you tour the home.