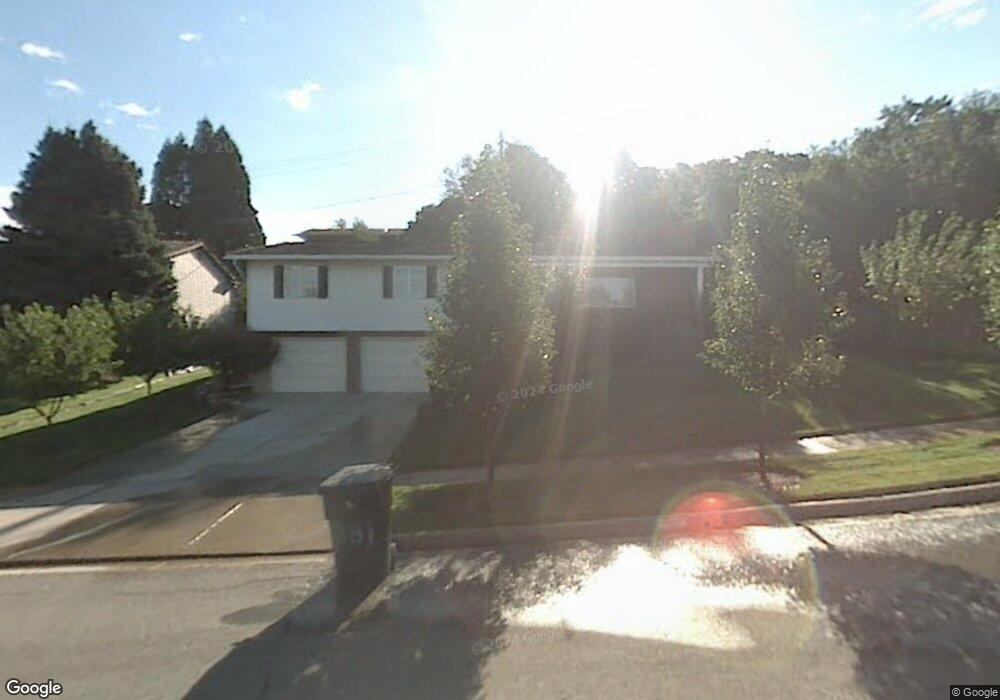
1881 S 850 E Bountiful, UT 84010
Estimated Value: $582,000 - $635,000
4
Beds
3
Baths
2,327
Sq Ft
$260/Sq Ft
Est. Value
About This Home
This home is located at 1881 S 850 E, Bountiful, UT 84010 and is currently estimated at $604,471, approximately $259 per square foot. 1881 S 850 E is a home located in Davis County with nearby schools including Muir School, Mueller Park Junior High School, and Bountiful High School.
Ownership History
Date
Name
Owned For
Owner Type
Purchase Details
Closed on
Oct 7, 2009
Sold by
Larson James E and Larson Beth N
Bought by
Butterfield Michael and Butterfield Danielle
Current Estimated Value
Home Financials for this Owner
Home Financials are based on the most recent Mortgage that was taken out on this home.
Original Mortgage
$225,735
Outstanding Balance
$147,254
Interest Rate
5.14%
Mortgage Type
FHA
Estimated Equity
$457,217
Purchase Details
Closed on
Jan 9, 2001
Sold by
Cahoon Michael L and Cahoon Sasha C
Bought by
Larson James E and Larson Beth N
Purchase Details
Closed on
Feb 26, 1999
Sold by
J H & Margaret Elton Revocable Family Tr and Elton Margaret Kathleen
Bought by
Cahoon Michael L and Cahoon Sasha C
Home Financials for this Owner
Home Financials are based on the most recent Mortgage that was taken out on this home.
Original Mortgage
$150,000
Interest Rate
6.78%
Create a Home Valuation Report for This Property
The Home Valuation Report is an in-depth analysis detailing your home's value as well as a comparison with similar homes in the area
Purchase History
| Date | Buyer | Sale Price | Title Company |
|---|---|---|---|
| Butterfield Michael | -- | Advanced Title Ins Ag Slc | |
| Larson James E | -- | Western States Title Company | |
| Cahoon Michael L | -- | First American Title Co |
Source: Public Records
Mortgage History
| Date | Status | Borrower | Loan Amount |
|---|---|---|---|
| Open | Butterfield Michael | $225,735 | |
| Previous Owner | Cahoon Michael L | $150,000 |
Source: Public Records
Tax History
| Year | Tax Paid | Tax Assessment Tax Assessment Total Assessment is a certain percentage of the fair market value that is determined by local assessors to be the total taxable value of land and additions on the property. | Land | Improvement |
|---|---|---|---|---|
| 2025 | $3,187 | $290,950 | $95,160 | $195,790 |
| 2024 | $2,977 | $281,600 | $87,816 | $193,784 |
| 2023 | $2,966 | $510,000 | $158,197 | $351,803 |
| 2022 | $3,038 | $286,550 | $84,096 | $202,454 |
| 2021 | $2,686 | $387,000 | $124,902 | $262,098 |
| 2020 | $2,348 | $339,000 | $113,753 | $225,247 |
| 2019 | $2,361 | $333,000 | $114,358 | $218,642 |
| 2018 | $2,514 | $352,000 | $141,221 | $210,779 |
| 2016 | $1,937 | $145,696 | $43,863 | $101,833 |
| 2015 | $1,872 | $132,826 | $43,863 | $88,963 |
| 2014 | $1,741 | $126,501 | $43,863 | $82,638 |
| 2013 | -- | $116,182 | $59,840 | $56,342 |
Source: Public Records
Map
Nearby Homes
- 771 E 1825 S
- 1997 S 800 E
- 1087 Arlington Way
- 2136 Elaine Dr
- 842 E 2150 S
- 631 E 1700 S
- 626 E 2150 S
- 1886 S Jeri Dr
- 795 Abby Ln Unit 5
- 438 E 1800 S
- 2059 S 350 E Unit 6
- 2038 S 350 E Unit 3
- 2046 S 350 E Unit 4
- 861 E Millbrook Way
- 291 E 1950 S
- 320 E 2100 S
- 380 E 1500 S
- 257 E 2050 S
- 0 Bountiful Blvd
- 1475 Mueller Park Rd
Your Personal Tour Guide
Ask me questions while you tour the home.