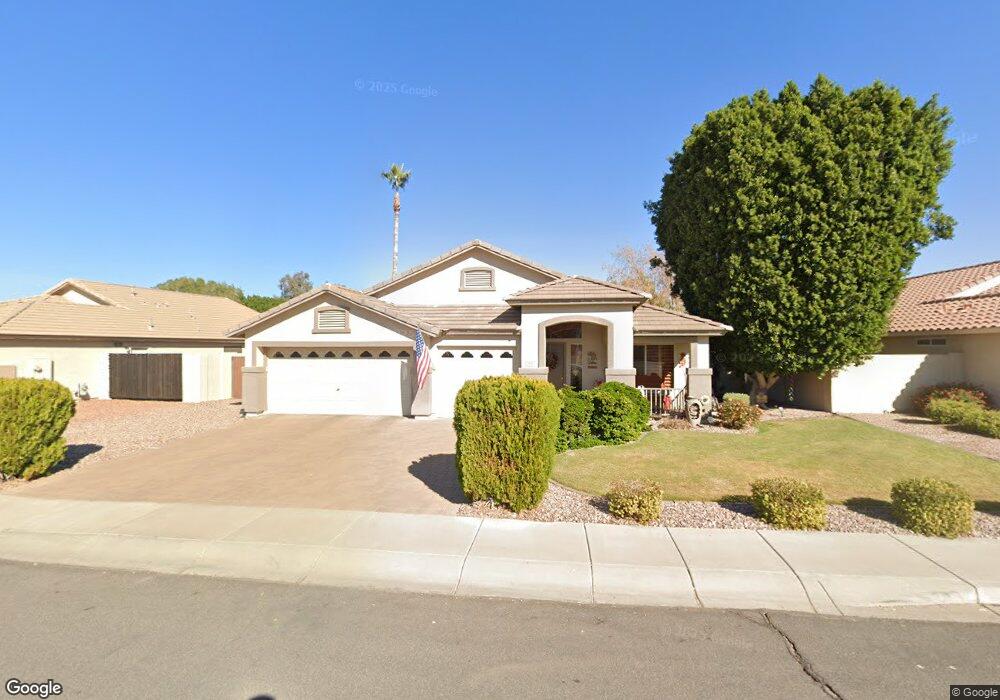
1882 E Shannon St Chandler, AZ 85225
East Chandler NeighborhoodEstimated Value: $525,613 - $621,000
3
Beds
2
Baths
2,136
Sq Ft
$274/Sq Ft
Est. Value
About This Home
This home is located at 1882 E Shannon St, Chandler, AZ 85225 and is currently estimated at $585,653, approximately $274 per square foot. 1882 E Shannon St is a home located in Maricopa County with nearby schools including Sanborn Elementary School, Willis Junior High School, and Chandler High School.
Ownership History
Date
Name
Owned For
Owner Type
Purchase Details
Closed on
Oct 3, 2003
Sold by
Haddox Christopher L and Haddox Franca Maria
Bought by
Dehler Robert W and Dehler Kathleen
Current Estimated Value
Home Financials for this Owner
Home Financials are based on the most recent Mortgage that was taken out on this home.
Original Mortgage
$174,400
Outstanding Balance
$82,445
Interest Rate
6.4%
Mortgage Type
New Conventional
Estimated Equity
$503,208
Purchase Details
Closed on
Apr 14, 1999
Sold by
Fulton Homes Sales Corp
Bought by
Haddox Christopher L and Haddox Franca Maria
Home Financials for this Owner
Home Financials are based on the most recent Mortgage that was taken out on this home.
Original Mortgage
$166,923
Interest Rate
7.04%
Mortgage Type
VA
Create a Home Valuation Report for This Property
The Home Valuation Report is an in-depth analysis detailing your home's value as well as a comparison with similar homes in the area
Home Values in the Area
Average Home Value in this Area
Purchase History
| Date | Buyer | Sale Price | Title Company |
|---|---|---|---|
| Dehler Robert W | $218,000 | North American Title Company | |
| Haddox Christopher L | $164,072 | Security Title Agency | |
| Fulton Homes Sales Corp | $103,157 | Security Title Agency |
Source: Public Records
Mortgage History
| Date | Status | Borrower | Loan Amount |
|---|---|---|---|
| Open | Dehler Robert W | $174,400 | |
| Previous Owner | Haddox Christopher L | $166,923 |
Source: Public Records
Tax History
| Year | Tax Paid | Tax Assessment Tax Assessment Total Assessment is a certain percentage of the fair market value that is determined by local assessors to be the total taxable value of land and additions on the property. | Land | Improvement |
|---|---|---|---|---|
| 2025 | $2,157 | $27,694 | -- | -- |
| 2024 | $2,084 | $26,375 | -- | -- |
| 2023 | $2,084 | $41,810 | $8,360 | $33,450 |
| 2022 | $2,010 | $31,830 | $6,360 | $25,470 |
| 2021 | $2,107 | $29,980 | $5,990 | $23,990 |
| 2020 | $2,098 | $28,050 | $5,610 | $22,440 |
| 2019 | $2,018 | $25,910 | $5,180 | $20,730 |
| 2018 | $1,954 | $25,350 | $5,070 | $20,280 |
| 2017 | $1,821 | $23,720 | $4,740 | $18,980 |
| 2016 | $1,754 | $23,070 | $4,610 | $18,460 |
| 2015 | $1,700 | $21,100 | $4,220 | $16,880 |
Source: Public Records
Map
Nearby Homes
- 1691 E Gary Dr
- 741 N Soho Place
- 1594 E Megan St
- 1126 N Melody Cir
- 1650 E Countrywalk Ln
- 1402 E Shannon St
- 1951 E Baylor Ct
- 1779 E Oakland St
- 1940 E Oakland St
- 1774 S 131st St
- 1030 N Mason Dr
- 1680 E Sheffield Ave
- 750 W Golden St
- 1903 E Jasper Dr
- 2085 E Hulet Place
- 1700 E Kent Ave
- 420 N Leoma Ln
- 1146 E Dublin St
- 1449 E Kent Ave
- 414 N Hudson Place
- 1872 E Shannon St
- 1892 E Shannon St
- 1891 E Ross Dr
- 1881 E Ross Dr
- 1902 E Shannon St
- 1862 E Shannon St
- 1901 E Ross Dr
- 1883 E Shannon St
- 1871 E Ross Dr
- 1873 E Shannon St
- 1893 E Shannon St
- 1912 E Shannon St
- 1852 E Shannon St
- 1911 E Ross Dr
- 1863 E Shannon St
- 1903 E Shannon St
- 1861 E Ross Dr
- 1853 E Shannon St
- 1913 E Shannon St
- 813 N Danyell Dr