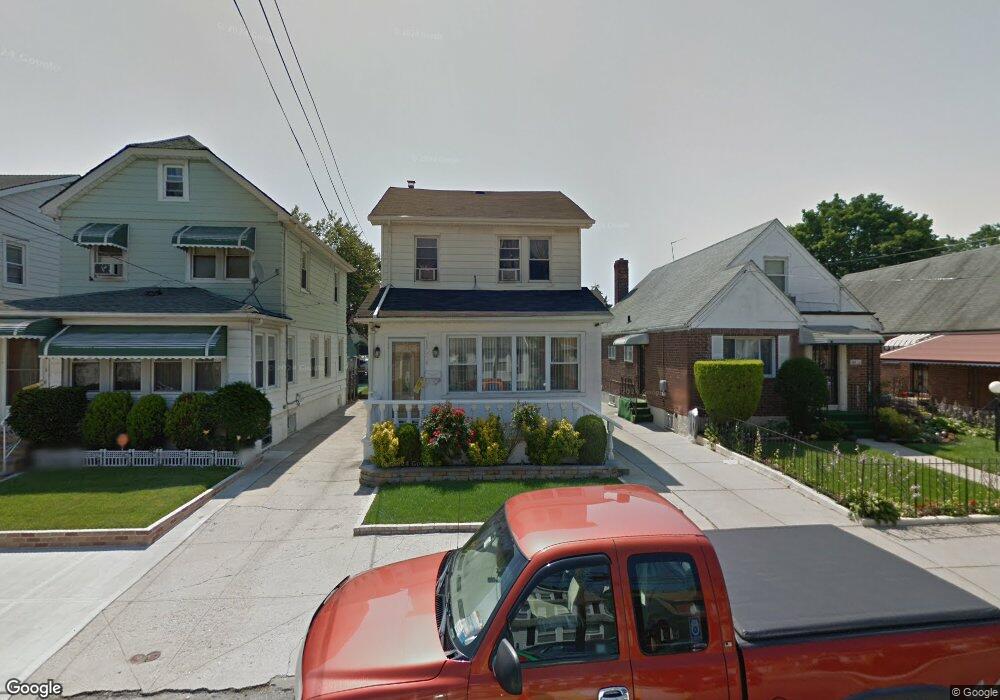
18820 Keeseville Ave Saint Albans, NY 11412
Hollis NeighborhoodEstimated Value: $601,173 - $783,000
--
Bed
--
Bath
1,388
Sq Ft
$503/Sq Ft
Est. Value
About This Home
This home is located at 18820 Keeseville Ave, Saint Albans, NY 11412 and is currently estimated at $698,043, approximately $502 per square foot. 18820 Keeseville Ave is a home located in Queens County with nearby schools including P.S. 118 Lorraine Hansberry, I.S. 192 The Linden, and Riverton Street Charter School.
Ownership History
Date
Name
Owned For
Owner Type
Purchase Details
Closed on
Feb 21, 2000
Sold by
Pasotte Romould
Bought by
Garcia Janice and Garcia Stephen A
Current Estimated Value
Purchase Details
Closed on
Jun 28, 1999
Sold by
Lowe Angella
Bought by
Pajotte Romould
Home Financials for this Owner
Home Financials are based on the most recent Mortgage that was taken out on this home.
Original Mortgage
$179,450
Interest Rate
7.83%
Purchase Details
Closed on
Feb 8, 1999
Sold by
Thompson Janice S
Bought by
Lowe Angella
Home Financials for this Owner
Home Financials are based on the most recent Mortgage that was taken out on this home.
Original Mortgage
$108,000
Interest Rate
6.74%
Purchase Details
Closed on
Dec 26, 1997
Sold by
Thompson Janice Slyfield and Thompson Lefroy
Bought by
Thompson Janice S
Create a Home Valuation Report for This Property
The Home Valuation Report is an in-depth analysis detailing your home's value as well as a comparison with similar homes in the area
Home Values in the Area
Average Home Value in this Area
Purchase History
| Date | Buyer | Sale Price | Title Company |
|---|---|---|---|
| Garcia Janice | -- | -- | |
| Garcia Janice | -- | -- | |
| Pajotte Romould | $185,000 | Stewart Title Insurance Co | |
| Pajotte Romould | $185,000 | Stewart Title Insurance Co | |
| Lowe Angella | $120,000 | -- | |
| Lowe Angella | $120,000 | -- | |
| Thompson Janice S | -- | First American Title Ins Co | |
| Thompson Janice S | -- | First American Title Ins Co |
Source: Public Records
Mortgage History
| Date | Status | Borrower | Loan Amount |
|---|---|---|---|
| Previous Owner | Pajotte Romould | $179,450 | |
| Previous Owner | Lowe Angella | $108,000 |
Source: Public Records
Tax History Compared to Growth
Tax History
| Year | Tax Paid | Tax Assessment Tax Assessment Total Assessment is a certain percentage of the fair market value that is determined by local assessors to be the total taxable value of land and additions on the property. | Land | Improvement |
|---|---|---|---|---|
| 2025 | $4,596 | $25,740 | $7,376 | $18,364 |
| 2024 | $2,364 | $24,283 | $6,535 | $17,748 |
| 2023 | $4,592 | $24,264 | $6,662 | $17,602 |
| 2022 | $2,283 | $39,000 | $11,400 | $27,600 |
| 2021 | $2,489 | $35,640 | $11,400 | $24,240 |
| 2020 | $4,244 | $30,660 | $11,400 | $19,260 |
| 2019 | $3,940 | $32,160 | $11,400 | $20,760 |
| 2018 | $3,824 | $20,220 | $8,352 | $11,868 |
| 2017 | $3,589 | $19,076 | $8,548 | $10,528 |
| 2016 | $3,478 | $19,076 | $8,548 | $10,528 |
| 2015 | $1,951 | $17,875 | $10,084 | $7,791 |
| 2014 | $1,951 | $16,864 | $8,808 | $8,056 |
Source: Public Records
Map
Nearby Homes
- 18833 Keeseville Ave
- 188-07 Mangin Ave
- 18823 Mangin Ave
- 188-25 Mangin Ave
- 187-44 Jordan Ave
- 18908 114th Rd
- 189-18 114th Dr
- 19022 111th Rd
- 188-45 Quencer Rd
- 188-31 Jordan Ave
- 186-16 Hilburn Ave
- 111-06 Farmers Blvd
- 191-40 112th Rd
- 191-16 114th Rd
- 190-59 112th Ave
- 190-63 112th Ave
- 191-34 114th Rd
- 194-16 112th Ave
- 187-15 Tioga Dr
- 183-34 Fonda Ave
- 18822 Keeseville Ave
- 18816 Keeseville Ave
- 18826 Keeseville Ave
- 18812 Keeseville Ave
- 18828 Keeseville Ave
- 18919 Lewiston Ave
- 18911 Lewiston Ave
- 18925 Lewiston Ave
- 18832 Keeseville Ave
- 188-41 Keeseville Ave
- 188-29 Keeseville Ave
- 18907 Lewiston Ave
- 112-59 Mayville St
- 11255 Mayville St
- 188-25 Keeseville Ave
- 18834 Keeseville Ave
- 18834 Keeseville Ave
- 18929 Lewiston Ave
- 18811 Keeseville Ave