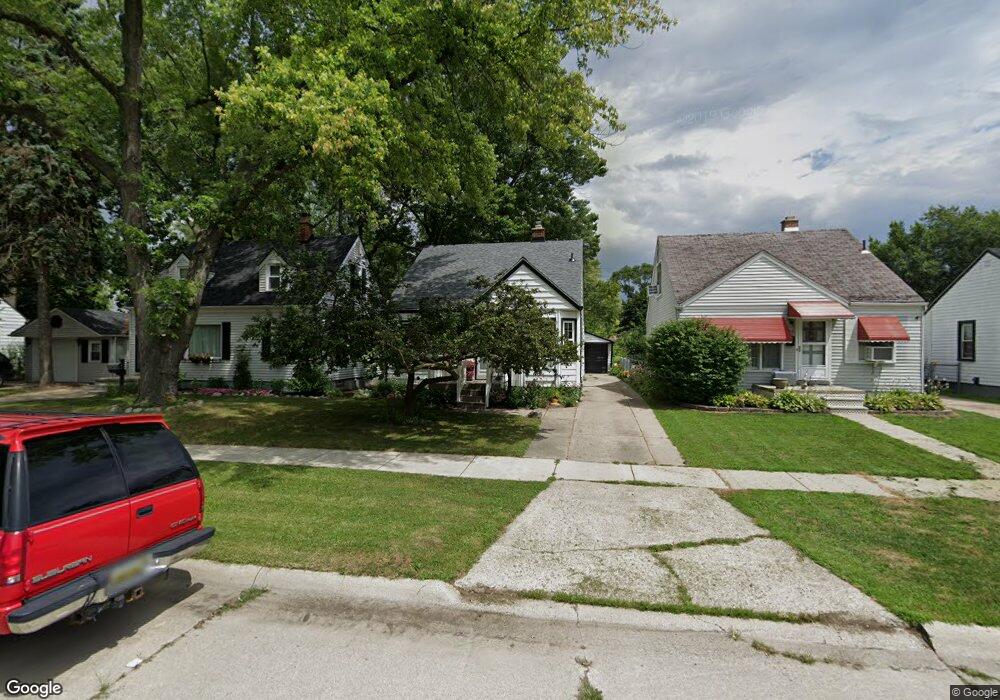
18820 Sumner Redford, MI 48240
Estimated Value: $137,957 - $179,000
--
Bed
1
Bath
1,002
Sq Ft
$154/Sq Ft
Est. Value
About This Home
This home is located at 18820 Sumner, Redford, MI 48240 and is currently estimated at $154,239, approximately $153 per square foot. 18820 Sumner is a home located in Wayne County with nearby schools including Beech Elementary School, Hilbert Middle School, and Redford Union High School.
Ownership History
Date
Name
Owned For
Owner Type
Purchase Details
Closed on
Jun 19, 2020
Sold by
Yokom Barbara S
Bought by
Yokom Barbara S and The Barbara S Yokom Lvivng Tru
Current Estimated Value
Purchase Details
Closed on
May 6, 2004
Sold by
Yokom Barbara S and Barbara S Yokom Living Trust
Bought by
Yokom Barbara S
Home Financials for this Owner
Home Financials are based on the most recent Mortgage that was taken out on this home.
Original Mortgage
$65,000
Interest Rate
5.85%
Mortgage Type
New Conventional
Purchase Details
Closed on
Aug 27, 2001
Sold by
Yokom Barbara S
Bought by
Yokom Barbara S
Create a Home Valuation Report for This Property
The Home Valuation Report is an in-depth analysis detailing your home's value as well as a comparison with similar homes in the area
Home Values in the Area
Average Home Value in this Area
Purchase History
| Date | Buyer | Sale Price | Title Company |
|---|---|---|---|
| Yokom Barbara S | -- | None Available | |
| Yokom Barbara S | -- | Dba Clear Financial Services | |
| Yokom Barbara S | -- | -- |
Source: Public Records
Mortgage History
| Date | Status | Borrower | Loan Amount |
|---|---|---|---|
| Closed | Yokom Barbara S | $65,000 |
Source: Public Records
Tax History Compared to Growth
Tax History
| Year | Tax Paid | Tax Assessment Tax Assessment Total Assessment is a certain percentage of the fair market value that is determined by local assessors to be the total taxable value of land and additions on the property. | Land | Improvement |
|---|---|---|---|---|
| 2025 | $688 | $71,500 | $0 | $0 |
| 2024 | $688 | $65,300 | $0 | $0 |
| 2023 | $624 | $52,100 | $0 | $0 |
| 2022 | $1,594 | $44,700 | $0 | $0 |
| 2021 | $1,550 | $40,400 | $0 | $0 |
| 2020 | $1,530 | $33,100 | $0 | $0 |
| 2019 | $1,497 | $30,900 | $0 | $0 |
| 2018 | $562 | $22,500 | $0 | $0 |
| 2017 | $1,451 | $21,800 | $0 | $0 |
| 2016 | $1,276 | $22,200 | $0 | $0 |
| 2015 | $2,020 | $20,200 | $0 | $0 |
| 2013 | $2,010 | $20,900 | $0 | $0 |
| 2012 | $1,403 | $23,600 | $6,000 | $17,600 |
Source: Public Records
Map
Nearby Homes