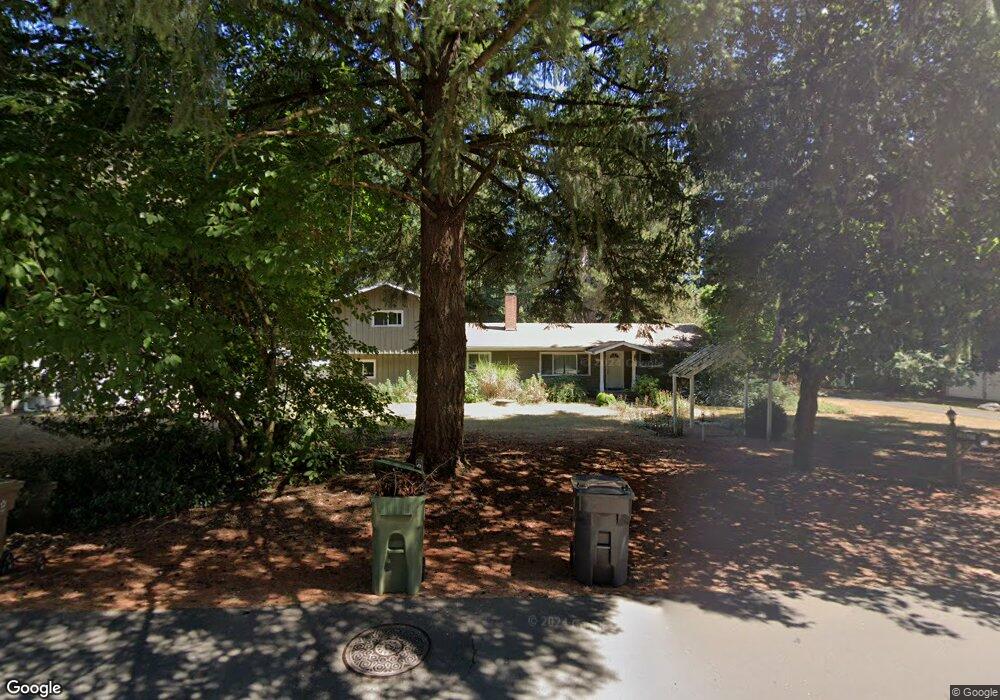
18820 SW 65th Ave Lake Oswego, OR 97035
Rosewood NeighborhoodEstimated Value: $656,000 - $826,000
3
Beds
3
Baths
2,268
Sq Ft
$323/Sq Ft
Est. Value
About This Home
This home is located at 18820 SW 65th Ave, Lake Oswego, OR 97035 and is currently estimated at $732,078, approximately $322 per square foot. 18820 SW 65th Ave is a home located in Clackamas County with nearby schools including River Grove Elementary School, Lakeridge Middle School, and Lakeridge High School.
Ownership History
Date
Name
Owned For
Owner Type
Purchase Details
Closed on
May 30, 2019
Sold by
Price Joshua Michael and Price Kelly L
Bought by
Misumi Frederic and Misumi Angela
Current Estimated Value
Home Financials for this Owner
Home Financials are based on the most recent Mortgage that was taken out on this home.
Original Mortgage
$462,175
Outstanding Balance
$404,672
Interest Rate
4.1%
Mortgage Type
New Conventional
Estimated Equity
$327,406
Purchase Details
Closed on
Jun 13, 2016
Sold by
Magill Mari
Bought by
Price Joshua Michael and Price Kelly L
Home Financials for this Owner
Home Financials are based on the most recent Mortgage that was taken out on this home.
Original Mortgage
$417,000
Interest Rate
3.66%
Mortgage Type
VA
Purchase Details
Closed on
May 23, 2005
Sold by
Mcneil William J
Bought by
Magill Mari
Home Financials for this Owner
Home Financials are based on the most recent Mortgage that was taken out on this home.
Original Mortgage
$215,600
Interest Rate
5.84%
Mortgage Type
Fannie Mae Freddie Mac
Create a Home Valuation Report for This Property
The Home Valuation Report is an in-depth analysis detailing your home's value as well as a comparison with similar homes in the area
Home Values in the Area
Average Home Value in this Area
Purchase History
| Date | Buyer | Sale Price | Title Company |
|---|---|---|---|
| Misumi Frederic | $486,500 | Wfg Title | |
| Price Joshua Michael | $422,150 | Wfg Title | |
| Magill Mari | $269,500 | Ticor Title Insurance Compan |
Source: Public Records
Mortgage History
| Date | Status | Borrower | Loan Amount |
|---|---|---|---|
| Open | Misumi Frederic | $462,175 | |
| Previous Owner | Price Joshua Michael | $417,000 | |
| Previous Owner | Magill Mari | $215,600 |
Source: Public Records
Tax History Compared to Growth
Tax History
| Year | Tax Paid | Tax Assessment Tax Assessment Total Assessment is a certain percentage of the fair market value that is determined by local assessors to be the total taxable value of land and additions on the property. | Land | Improvement |
|---|---|---|---|---|
| 2025 | $5,533 | $318,732 | -- | -- |
| 2024 | $5,389 | $309,449 | -- | -- |
| 2023 | $5,389 | $300,436 | $0 | $0 |
| 2022 | $5,084 | $291,686 | $0 | $0 |
| 2021 | $4,660 | $283,191 | $0 | $0 |
| 2020 | $4,542 | $274,943 | $0 | $0 |
| 2019 | $4,240 | $255,437 | $0 | $0 |
| 2018 | $4,079 | $247,997 | $0 | $0 |
| 2017 | $3,931 | $240,774 | $0 | $0 |
| 2016 | $3,541 | $233,761 | $0 | $0 |
| 2015 | $3,410 | $226,952 | $0 | $0 |
| 2014 | $3,362 | $220,342 | $0 | $0 |
Source: Public Records
Map
Nearby Homes
- 6375 SW Dawn St
- 18411 Longfellow Ave
- 19060 Terry Ave
- 6050 Fernbrook St
- 19222 Benfield Ave
- 17928 Royal Ct
- 5513 Rachel Ln
- 19368 Riverwood Ln
- 5736 SW Natchez St
- 18978 Arrowwood Ave
- 7165 SW Sagert St Unit 107
- 5393 SW Wichita St
- 7143 SW Sagert St Unit 104
- 19685 SW 68th Ave
- 19778 SW 68th Ave
- 19787 SW 67th Ave
- 18863 Indian Springs Rd
- 19130 SW 51st Ave
- 18434 Sandpiper Cir
- 6244 Frost Ln
- 18820 65th Ave
- 18830 65th Ave
- 18840 65th Ave
- 18840 SW 65th Ave
- 6430 Mcewan Rd
- 6463 Dawn Ave
- 6451 Dawn Ave
- 6480 Mcewan Rd
- 6400 Mcewan Rd
- 6419 Dawn Ave
- 18850 65th Ave
- 6419 SW Dawn St
- 6375 Dawn Ave
- 6360 Mcewan Rd
- 6355 Dawn Ave
- 6355 SW Dawn St
- 6447 SW Mcewan Rd
- 6267 Wayzata Ct
- 6472 SW Dawn St
- 6262 Wayzata Ct