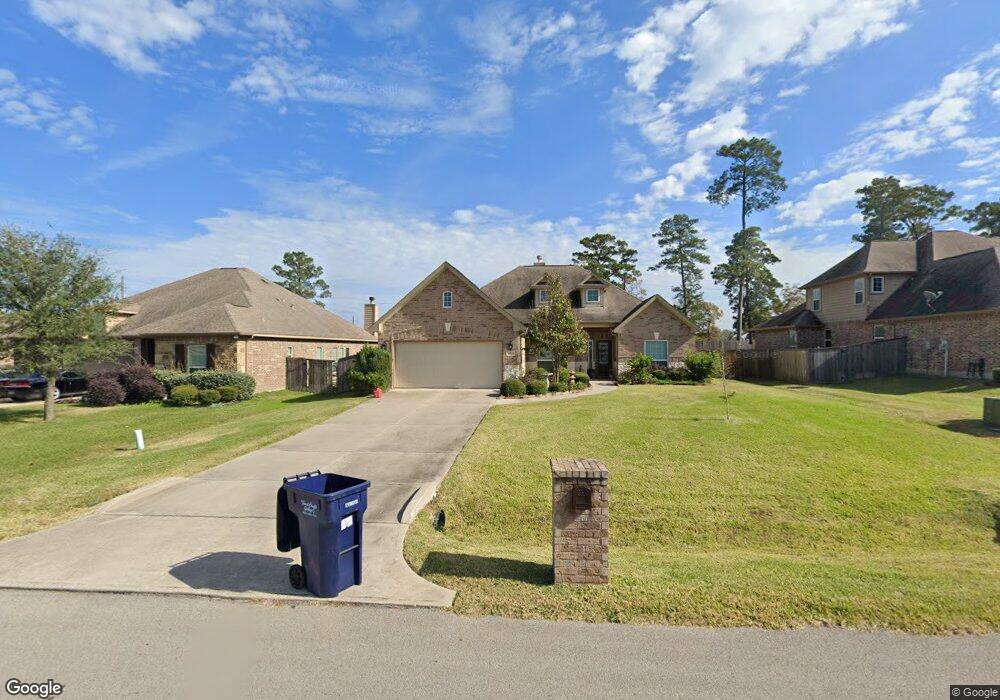
18823 Maverick Ranch Rd E Magnolia, TX 77355
Estimated Value: $346,000 - $358,000
--
Bed
--
Bath
2,182
Sq Ft
$161/Sq Ft
Est. Value
About This Home
This home is located at 18823 Maverick Ranch Rd E, Magnolia, TX 77355 and is currently estimated at $352,250, approximately $161 per square foot. 18823 Maverick Ranch Rd E is a home with nearby schools including Willie E. Williams Elementary School, Magnolia Sixth Grade Campus, and Magnolia Junior High School.
Ownership History
Date
Name
Owned For
Owner Type
Purchase Details
Closed on
Dec 14, 2018
Sold by
Griffith Justin and Griffith Casey
Bought by
Regina Michael
Current Estimated Value
Home Financials for this Owner
Home Financials are based on the most recent Mortgage that was taken out on this home.
Original Mortgage
$187,000
Outstanding Balance
$164,751
Interest Rate
4.8%
Mortgage Type
New Conventional
Estimated Equity
$187,499
Purchase Details
Closed on
May 1, 2013
Sold by
Serenity Builders Of Texas Llc
Bought by
Griffith Justin and Griffith Casey
Home Financials for this Owner
Home Financials are based on the most recent Mortgage that was taken out on this home.
Original Mortgage
$216,811
Interest Rate
3.58%
Mortgage Type
New Conventional
Purchase Details
Closed on
Dec 6, 2012
Sold by
White Oak Developers Inc
Bought by
Griffith Justin and Griffith Casey
Create a Home Valuation Report for This Property
The Home Valuation Report is an in-depth analysis detailing your home's value as well as a comparison with similar homes in the area
Home Values in the Area
Average Home Value in this Area
Purchase History
| Date | Buyer | Sale Price | Title Company |
|---|---|---|---|
| Regina Michael | -- | Fidelity National Title | |
| Griffith Justin | -- | Fidelity National Title | |
| Griffith Justin | -- | -- |
Source: Public Records
Mortgage History
| Date | Status | Borrower | Loan Amount |
|---|---|---|---|
| Open | Regina Michael | $187,000 | |
| Previous Owner | Griffith Justin | $216,811 |
Source: Public Records
Tax History Compared to Growth
Tax History
| Year | Tax Paid | Tax Assessment Tax Assessment Total Assessment is a certain percentage of the fair market value that is determined by local assessors to be the total taxable value of land and additions on the property. | Land | Improvement |
|---|---|---|---|---|
| 2025 | $2,440 | $337,000 | $31,214 | $305,786 |
| 2024 | $2,412 | $329,340 | -- | -- |
| 2023 | $2,412 | $299,400 | $31,210 | $315,140 |
| 2022 | $4,803 | $272,180 | $31,210 | $290,710 |
| 2021 | $4,599 | $247,440 | $31,210 | $216,230 |
| 2020 | $5,249 | $259,360 | $31,210 | $228,150 |
| 2019 | $5,065 | $251,480 | $31,210 | $220,270 |
| 2018 | $4,372 | $235,100 | $14,830 | $220,270 |
| 2017 | $4,985 | $235,100 | $14,830 | $220,270 |
| 2016 | $4,821 | $227,360 | $14,830 | $212,530 |
| 2015 | $4,165 | $218,180 | $14,830 | $203,350 |
| 2014 | $4,165 | $204,180 | $10,000 | $194,180 |
Source: Public Records
Map
Nearby Homes
- 18846 Maverick Ranch Rd W
- 34310 High Point Dr
- 34030 Old Hempstead Rd
- 537 Ruel Ln
- 32210 Park Meadow Pass
- 32118 River Park Dr
- 32127 River Park Dr
- 32210 Mink Creek Ct
- 19135 Ranchcrest Dr
- 21742 Whielden Heights Way
- 21738 Whielden Heights Way
- 21710 Whielden Heights Way
- 21706 Whielden Heights Way
- 19016 Magnolia Willow Ln
- 19032 Magnolia Willow Ln
- 000 County Road 302
- TBD Scarlet Oak Dr
- Hanford Plan at Emory Glen
- Davenport Plan at Emory Glen
- Fordham Plan at Emory Glen
- 18819 Maverick Ranch Rd E
- 18827 Maverick Ranch Rd E
- 18815 Maverick Ranch Rd E
- 18831 Maverick Ranch Rd E
- 27002 Maverick Ranch Ct
- 18811 Maverick Ranch Rd E
- 18807 Maverick Ranch Rd E
- 18839 Maverick Ranch Rd E
- 18810 Maverick Ranch Rd E
- 27003 Maverick Ranch Ct
- 18803 Maverick Ranch Rd E
- 27010 Maverick Ranch Ct
- 18803 Maverick Ranch Rd Rd E
- 18883 Atascosa Trail
- 18887 Atascosa Trail
- 18843 Maverick Ranch Rd E
- 18891 Atascosa Trail
- 18806 Maverick Ranch Rd E
- 18778 Maverick
- 27007 Maverick Ranch Ct