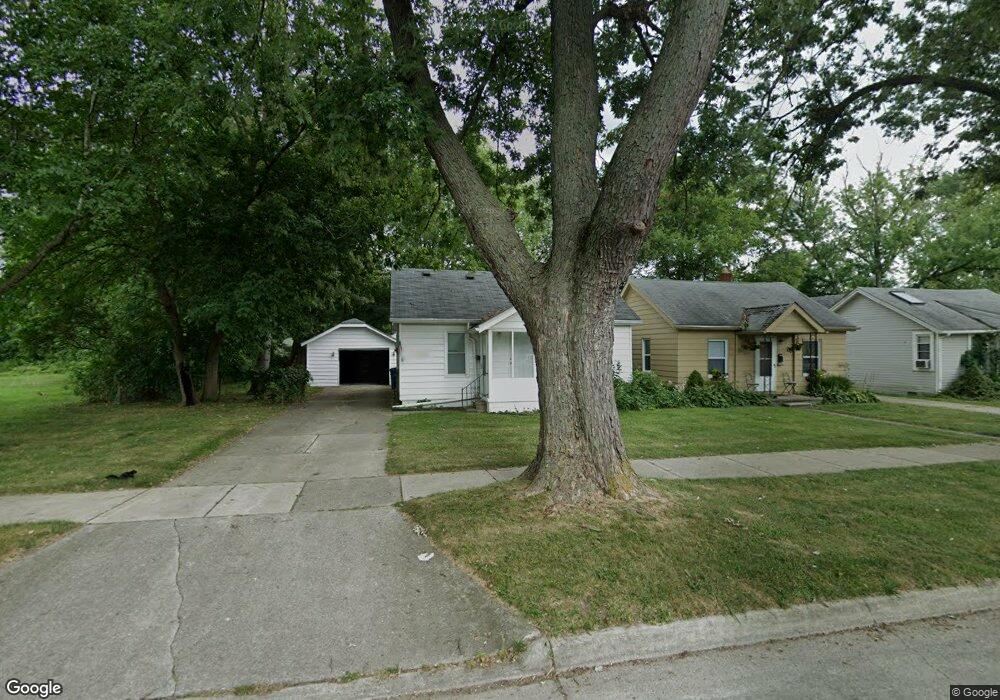
18828 Wakenden Unit Bldg-Unit Redford, MI 48240
Estimated Value: $106,268 - $120,000
--
Bed
1
Bath
732
Sq Ft
$152/Sq Ft
Est. Value
About This Home
This home is located at 18828 Wakenden Unit Bldg-Unit, Redford, MI 48240 and is currently estimated at $111,067, approximately $151 per square foot. 18828 Wakenden Unit Bldg-Unit is a home located in Wayne County with nearby schools including Beech Elementary School, Hilbert Elementary School, and David Ellis Academy West.
Ownership History
Date
Name
Owned For
Owner Type
Purchase Details
Closed on
Nov 23, 2022
Sold by
Chytyk Randolph N
Bought by
Kurtz Sonja
Current Estimated Value
Purchase Details
Closed on
Sep 25, 2018
Sold by
Bhatia Desh
Bought by
Chytyk Randolph N
Purchase Details
Closed on
Mar 15, 2005
Sold by
Johnson Brian and Johnson Scott
Bought by
Western United Life Assurance Co
Purchase Details
Closed on
Oct 25, 2002
Sold by
Ralph A Zammit Trust
Bought by
Western United Life Assurance Co
Purchase Details
Closed on
Mar 17, 1997
Sold by
Grima John J and Grima Stella R
Bought by
Ralph A Zammit Trust & Ralph A Zammit
Create a Home Valuation Report for This Property
The Home Valuation Report is an in-depth analysis detailing your home's value as well as a comparison with similar homes in the area
Home Values in the Area
Average Home Value in this Area
Purchase History
| Date | Buyer | Sale Price | Title Company |
|---|---|---|---|
| Kurtz Sonja | -- | Land Title | |
| Chytyk Randolph N | $60,000 | None Available | |
| Western United Life Assurance Co | -- | E Title Agency | |
| Western United Life Assurance Co | $41,584 | -- | |
| Ralph A Zammit Trust & Ralph A Zammit | $44,000 | -- | |
| Ralph A Zammit Trust & Ralph A Zammit | $44,000 | -- |
Source: Public Records
Mortgage History
| Date | Status | Borrower | Loan Amount |
|---|---|---|---|
| Closed | Chytyk Randolph N | $0 |
Source: Public Records
Tax History Compared to Growth
Tax History
| Year | Tax Paid | Tax Assessment Tax Assessment Total Assessment is a certain percentage of the fair market value that is determined by local assessors to be the total taxable value of land and additions on the property. | Land | Improvement |
|---|---|---|---|---|
| 2025 | $734 | $49,200 | $0 | $0 |
| 2024 | $734 | $45,200 | $0 | $0 |
| 2023 | $700 | $37,600 | $0 | $0 |
| 2022 | $1,766 | $33,100 | $0 | $0 |
| 2021 | $1,717 | $30,400 | $0 | $0 |
| 2020 | $1,694 | $25,600 | $0 | $0 |
| 2019 | $1,658 | $24,000 | $0 | $0 |
| 2018 | $778 | $18,700 | $0 | $0 |
| 2017 | $1,200 | $18,100 | $0 | $0 |
| 2016 | $1,359 | $17,900 | $0 | $0 |
| 2015 | $1,670 | $16,700 | $0 | $0 |
| 2013 | $1,650 | $17,100 | $0 | $0 |
| 2012 | $1,494 | $19,000 | $7,800 | $11,200 |
Source: Public Records
Map
Nearby Homes