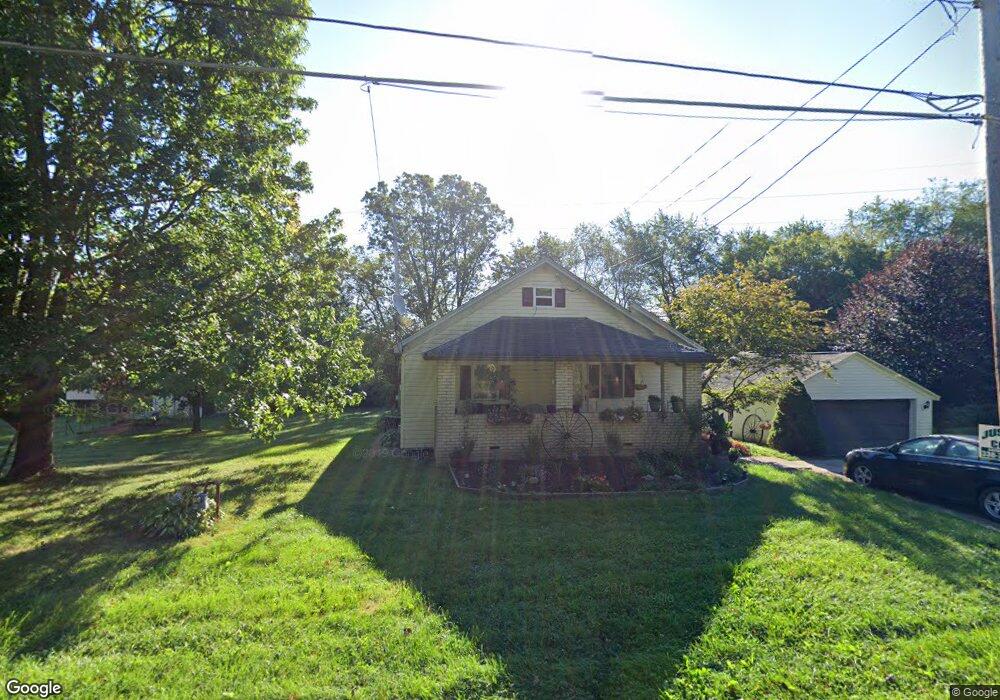
1883 Hubbard Masury Rd Hubbard, OH 44425
Estimated Value: $85,000 - $145,000
3
Beds
1
Bath
1,118
Sq Ft
$105/Sq Ft
Est. Value
About This Home
This home is located at 1883 Hubbard Masury Rd, Hubbard, OH 44425 and is currently estimated at $117,783, approximately $105 per square foot. 1883 Hubbard Masury Rd is a home located in Trumbull County with nearby schools including Hubbard Elementary School, Hubbard Middle School, and Hubbard High School.
Ownership History
Date
Name
Owned For
Owner Type
Purchase Details
Closed on
Jun 10, 2022
Sold by
Mound Ronald G
Bought by
Garner Hannah M
Current Estimated Value
Home Financials for this Owner
Home Financials are based on the most recent Mortgage that was taken out on this home.
Original Mortgage
$79,532
Outstanding Balance
$75,900
Interest Rate
5.62%
Mortgage Type
FHA
Estimated Equity
$41,883
Purchase Details
Closed on
Apr 4, 2012
Sold by
Mound Cynthia G
Bought by
Mound Ronald G
Purchase Details
Closed on
Jul 9, 1996
Sold by
Scott Alan N
Bought by
Mound Ronald G and Huntley Cynthia G
Home Financials for this Owner
Home Financials are based on the most recent Mortgage that was taken out on this home.
Original Mortgage
$41,710
Interest Rate
8.07%
Mortgage Type
FHA
Purchase Details
Closed on
Jan 1, 1990
Bought by
Alan Alan N and Alan S
Create a Home Valuation Report for This Property
The Home Valuation Report is an in-depth analysis detailing your home's value as well as a comparison with similar homes in the area
Home Values in the Area
Average Home Value in this Area
Purchase History
| Date | Buyer | Sale Price | Title Company |
|---|---|---|---|
| Garner Hannah M | -- | -- | |
| Mound Ronald G | -- | None Available | |
| Mound Ronald G | $43,000 | -- | |
| Alan Alan N | -- | -- |
Source: Public Records
Mortgage History
| Date | Status | Borrower | Loan Amount |
|---|---|---|---|
| Open | Garner Hannah M | $79,532 | |
| Previous Owner | Mound Ronald G | $41,710 |
Source: Public Records
Tax History Compared to Growth
Tax History
| Year | Tax Paid | Tax Assessment Tax Assessment Total Assessment is a certain percentage of the fair market value that is determined by local assessors to be the total taxable value of land and additions on the property. | Land | Improvement |
|---|---|---|---|---|
| 2024 | $1,461 | $25,170 | $2,630 | $22,540 |
| 2023 | $1,461 | $25,170 | $2,630 | $22,540 |
| 2022 | $1,175 | $18,490 | $2,490 | $16,000 |
| 2021 | $1,180 | $18,490 | $2,490 | $16,000 |
| 2020 | $1,185 | $18,490 | $2,490 | $16,000 |
| 2019 | $1,096 | $16,210 | $2,310 | $13,900 |
| 2018 | $1,064 | $16,210 | $2,310 | $13,900 |
| 2017 | $1,061 | $16,210 | $2,310 | $13,900 |
| 2016 | $1,046 | $16,770 | $2,310 | $14,460 |
| 2015 | $1,050 | $16,770 | $2,310 | $14,460 |
| 2014 | $1,029 | $16,770 | $2,310 | $14,460 |
| 2013 | $1,028 | $16,770 | $2,310 | $14,460 |
Source: Public Records
Map
Nearby Homes
- 1952 Hubbard Masury Rd
- 1911 Hubbard Thomas Rd
- 7847 Chestnut St
- 1354 Stevenson Rd
- 7737 Elm St
- 7111 Pine Grove Dr
- 7822 2nd St
- 1017 Broadway St
- 784 Elmwood Dr
- 11 Clubhouse Dr
- 462 Elizabeth St
- 1 Grandview Dr
- 104 Fruit Ave
- 6855 Stewart Sharon Rd
- 395 Elizabeth St
- 611 Moore St
- 506 Spearman Ave
- 132 Drummond Ave
- 764 Jones St
- 522 Wallis Ave
- 1871 Hubbard Masury Rd
- 1861 Hubbard Masury Rd
- 1857 Hubbard Masury Rd
- 1847 Hubbard Masury Rd
- 7722 Chestnut Ridge Rd
- 7736 Chestnut Ridge Rd
- 7724 Chestnut Ridge Rd
- 1934 Hubbard Masury Rd
- 1816 Masury Rd
- 7721 Chestnut Ridge Rd
- 1944 Hubbard Masury Rd
- 1804 Masury Rd
- 1794 Masury Rd
- 7790 Chestnut Ridge Rd
- 1961 Beatty Rd
- 1790 Masury Rd
- 7670 Chestnut Ridge Rd
- 1974 Beatty Rd
- 1776 Masury Rd
- 1943 Beatty Rd