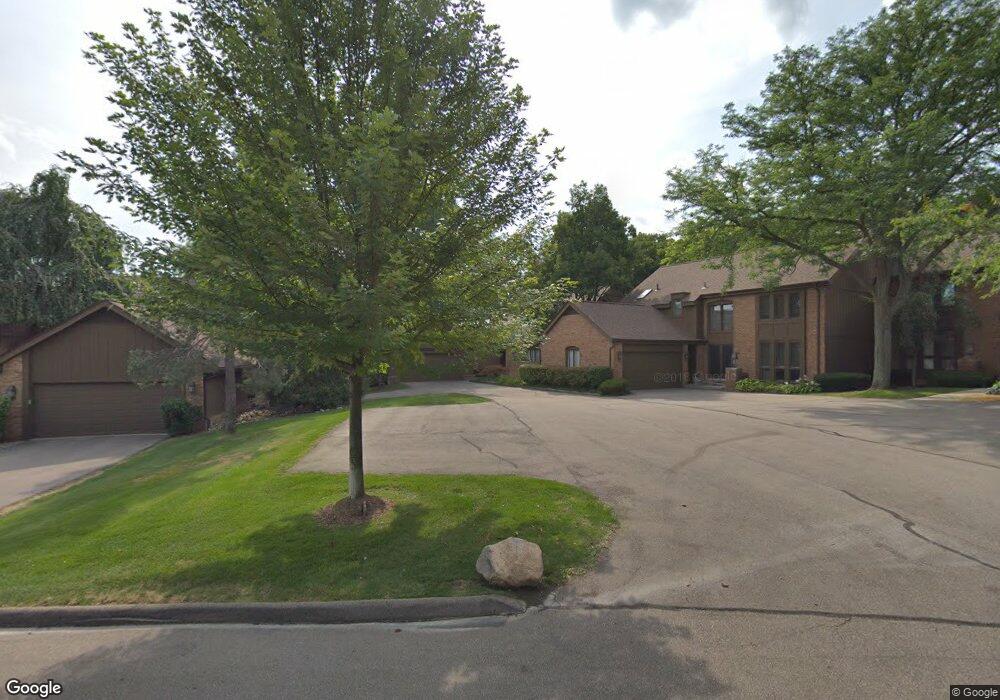
1883 Wingate Rd Unit 1 Bloomfield Hills, MI 48302
Estimated Value: $600,000 - $752,000
3
Beds
4
Baths
2,499
Sq Ft
$270/Sq Ft
Est. Value
About This Home
This home is located at 1883 Wingate Rd Unit 1, Bloomfield Hills, MI 48302 and is currently estimated at $675,425, approximately $270 per square foot. 1883 Wingate Rd Unit 1 is a home located in Oakland County with nearby schools including West Hills Middle School, Bloomfield Hills High School, and Bloomfield Christian School.
Ownership History
Date
Name
Owned For
Owner Type
Purchase Details
Closed on
Dec 21, 2017
Sold by
Desai Priyaranjan V
Bought by
Desai Priyaranjan V and The Priyaranjan V Desai Living Trust
Current Estimated Value
Purchase Details
Closed on
Nov 16, 2009
Sold by
Hakim Amelia M and Smith David B
Bought by
Desai Priyaranjan
Purchase Details
Closed on
Jun 29, 1998
Sold by
Vernick Richard L
Bought by
Hakim Amelia M
Home Financials for this Owner
Home Financials are based on the most recent Mortgage that was taken out on this home.
Original Mortgage
$150,000
Interest Rate
7.15%
Purchase Details
Closed on
Jun 10, 1996
Sold by
Mcculloch Thomas R
Bought by
Vernick Richard L
Create a Home Valuation Report for This Property
The Home Valuation Report is an in-depth analysis detailing your home's value as well as a comparison with similar homes in the area
Home Values in the Area
Average Home Value in this Area
Purchase History
| Date | Buyer | Sale Price | Title Company |
|---|---|---|---|
| Desai Priyaranjan V | -- | None Available | |
| Desai Priyaranjan | $280,000 | None Available | |
| Hakim Amelia M | $320,000 | -- | |
| Vernick Richard L | $340,000 | -- |
Source: Public Records
Mortgage History
| Date | Status | Borrower | Loan Amount |
|---|---|---|---|
| Previous Owner | Hakim Amelia M | $150,000 |
Source: Public Records
Tax History Compared to Growth
Tax History
| Year | Tax Paid | Tax Assessment Tax Assessment Total Assessment is a certain percentage of the fair market value that is determined by local assessors to be the total taxable value of land and additions on the property. | Land | Improvement |
|---|---|---|---|---|
| 2024 | $2,724 | $263,110 | $0 | $0 |
| 2023 | $2,636 | $245,360 | $0 | $0 |
| 2022 | $5,106 | $219,180 | $0 | $0 |
| 2021 | $5,075 | $193,350 | $0 | $0 |
| 2020 | $2,411 | $173,710 | $0 | $0 |
| 2019 | $4,793 | $182,830 | $0 | $0 |
| 2018 | $4,819 | $186,810 | $0 | $0 |
| 2017 | $4,790 | $181,040 | $0 | $0 |
| 2016 | $4,803 | $175,900 | $0 | $0 |
| 2015 | -- | $147,520 | $0 | $0 |
| 2014 | -- | $115,770 | $0 | $0 |
| 2011 | -- | $117,940 | $0 | $0 |
Source: Public Records
Map
Nearby Homes
- 1795 Golf Ridge Dr Unit 19
- 4033 Fox Lake Dr
- 2045 Bordeaux St Unit 5
- 1992 Bent Tree Trail
- 4297 Wabeek Lake Dr S Unit 26
- 1887 Harvest Ln
- 3870 Glen Falls Dr
- 4174 Prescott Park Cir
- 4170 Prescott Park Cir
- 1853 W Bend Dr
- 2276 Shore Hill Dr
- 4260 E Newland Dr
- 3468 Pine Estates Dr
- 3377 Indian Summer Dr
- 3668 Bayou Dr
- 1735 Heron Ridge Dr
- 4123 Chimney Point Dr
- 0 Wendell Rd Unit 20250033815
- 2460 Turner St
- 1723 Heron Ridge Dr
- 1925 Golf Ridge Dr
- 1873 Wingate Rd
- 1885 Chipping Way
- 1893 Wingate Rd
- 1883 Chipping Way
- 1877 Chipping Way
- 1877 Chipping Way Unit 3
- 1937 Golf Ridge Dr
- 1895 Golf Ridge Dr Unit 2
- 1870 Chipping Way Unit Bldg-Unit
- 1889 Wingate Rd Unit 4, 4
- 1875 Chipping Way
- 1867 Chipping Way Unit 3
- 1865 Chipping Way Unit 2
- 1862 Chipping Way Unit 2
- 1864 Chipping Way
- 1870 Chipping Way
- 1872 Chipping Way Unit 1
- 1885 Golf Ridge Dr Unit 2
- 1895 Golf Ridge Dr