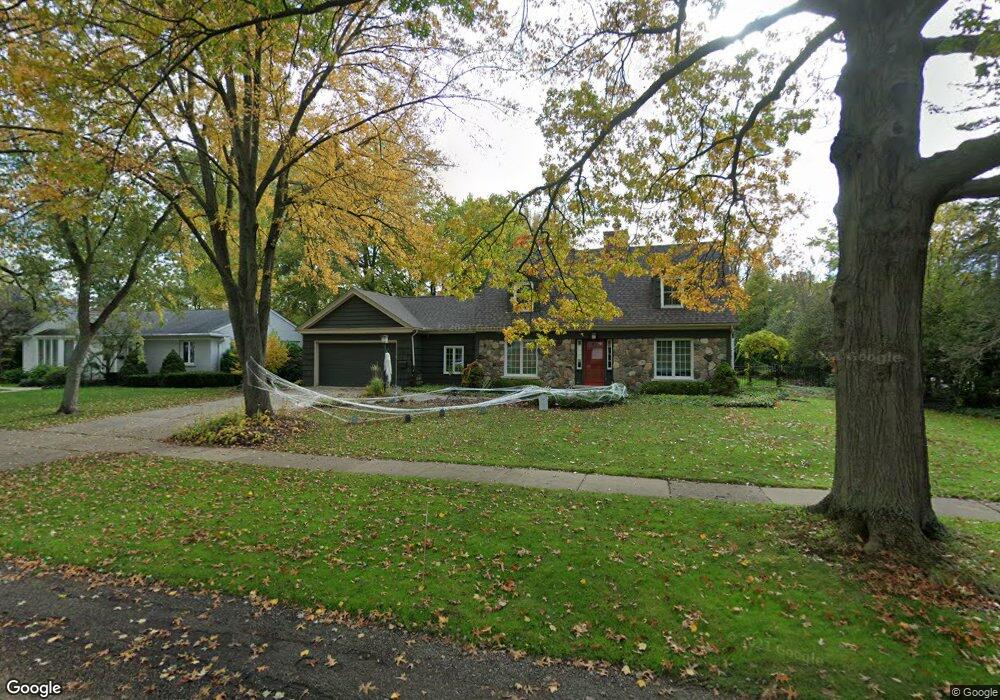
18835 Devonshire St Beverly Hills, MI 48025
Estimated Value: $633,916 - $820,000
3
Beds
3
Baths
2,427
Sq Ft
$311/Sq Ft
Est. Value
About This Home
This home is located at 18835 Devonshire St, Beverly Hills, MI 48025 and is currently estimated at $755,229, approximately $311 per square foot. 18835 Devonshire St is a home located in Oakland County with nearby schools including Beverly Elementary School, Wylie E. Groves High School, and Berkshire Middle School.
Ownership History
Date
Name
Owned For
Owner Type
Purchase Details
Closed on
Nov 15, 2024
Sold by
Prince John Scott
Bought by
Prince Jodi Kara
Current Estimated Value
Purchase Details
Closed on
Mar 16, 2016
Sold by
Stuppler Stephen and Stuppler Gloria
Bought by
Prince Jodi K and Prince John S
Home Financials for this Owner
Home Financials are based on the most recent Mortgage that was taken out on this home.
Original Mortgage
$218,000
Interest Rate
3.65%
Mortgage Type
New Conventional
Purchase Details
Closed on
Sep 5, 2014
Sold by
Stuppler Stephen and Stuppler Gloria
Bought by
Stuppler Stephen and Stuppler Gloria
Purchase Details
Closed on
Feb 3, 2011
Sold by
Barnhart Craig T and Barnhart Karen L
Bought by
Stuppler Stephen and Stuppler Gloria
Purchase Details
Closed on
Aug 21, 2003
Sold by
Beaudoen Russell R and Beaudoen Valerie A
Bought by
Barnhart Craig T and Barnhart Karen L
Create a Home Valuation Report for This Property
The Home Valuation Report is an in-depth analysis detailing your home's value as well as a comparison with similar homes in the area
Home Values in the Area
Average Home Value in this Area
Purchase History
| Date | Buyer | Sale Price | Title Company |
|---|---|---|---|
| Prince Jodi Kara | -- | None Listed On Document | |
| Prince Jodi Kara | -- | None Listed On Document | |
| Prince Jodi K | -- | Attorney | |
| Stuppler Stephen | -- | None Available | |
| Stuppler Stephen | $348,500 | Stewart Title Guaranty Co | |
| Barnhart Craig T | $420,000 | Devon Title Agency |
Source: Public Records
Mortgage History
| Date | Status | Borrower | Loan Amount |
|---|---|---|---|
| Previous Owner | Prince Jodi K | $218,000 |
Source: Public Records
Tax History
| Year | Tax Paid | Tax Assessment Tax Assessment Total Assessment is a certain percentage of the fair market value that is determined by local assessors to be the total taxable value of land and additions on the property. | Land | Improvement |
|---|---|---|---|---|
| 2025 | $4,214 | $295,400 | $0 | $0 |
| 2024 | $5,599 | $279,180 | $0 | $0 |
| 2023 | $5,372 | $268,350 | $0 | $0 |
| 2022 | $5,826 | $254,240 | $0 | $0 |
| 2021 | $5,874 | $245,290 | $0 | $0 |
| 2020 | $4,920 | $237,720 | $0 | $0 |
| 2019 | $3,887 | $227,470 | $0 | $0 |
| 2018 | $5,613 | $208,190 | $0 | $0 |
| 2017 | $5,588 | $208,190 | $0 | $0 |
| 2016 | $5,606 | $199,510 | $0 | $0 |
| 2015 | -- | $186,270 | $0 | $0 |
| 2014 | -- | $159,070 | $0 | $0 |
| 2011 | -- | $117,670 | $0 | $0 |
Source: Public Records
Map
Nearby Homes
- 18910 Devonshire St
- 19332 Beverly Rd
- 18930 Hillcrest St
- 31018 Pickwick Ln
- 31065 Tremont Ln
- 17330 Beverly Rd
- 18301 W 13 Mile Rd Unit A-2
- 17560 Birwood Ave
- 1932 Shipman Blvd
- 19710 W 13 Mile Rd Unit 107
- 19710 W 13 Mile Rd Unit 101
- 19710 W 13 Mile Rd Unit 108
- 19710 W 13 Mile Rd Unit 102
- 19710 W 13 Mile Rd Unit 210
- 19710 W 13 Mile Rd Unit 105
- 19710 W 13 Mile Rd Unit 111
- 19710 W 13 Mile Rd Unit 201
- 1850 Shipman Blvd
- 32700 Evergreen Rd
- 1787 Southfield Rd
- 18815 Devonshire St
- 18851 Devonshire St
- 18852 Beverly Rd
- 18840 Beverly Rd
- 18871 Devonshire St
- 18822 Beverly Rd
- 18882 Beverly Rd
- 18820 Devonshire St
- 18840 Devonshire St
- 18625 Devonshire St
- 18894 Beverly Rd
- 18881 Devonshire St
- 18810 Beverly Rd
- 18860 Devonshire St
- 18646 Devonshire St
- 18906 Beverly Rd
- 18628 Devonshire St
- 18605 Devonshire St
- 18819 Warwick St
- 18833 Warwick St
Your Personal Tour Guide
Ask me questions while you tour the home.