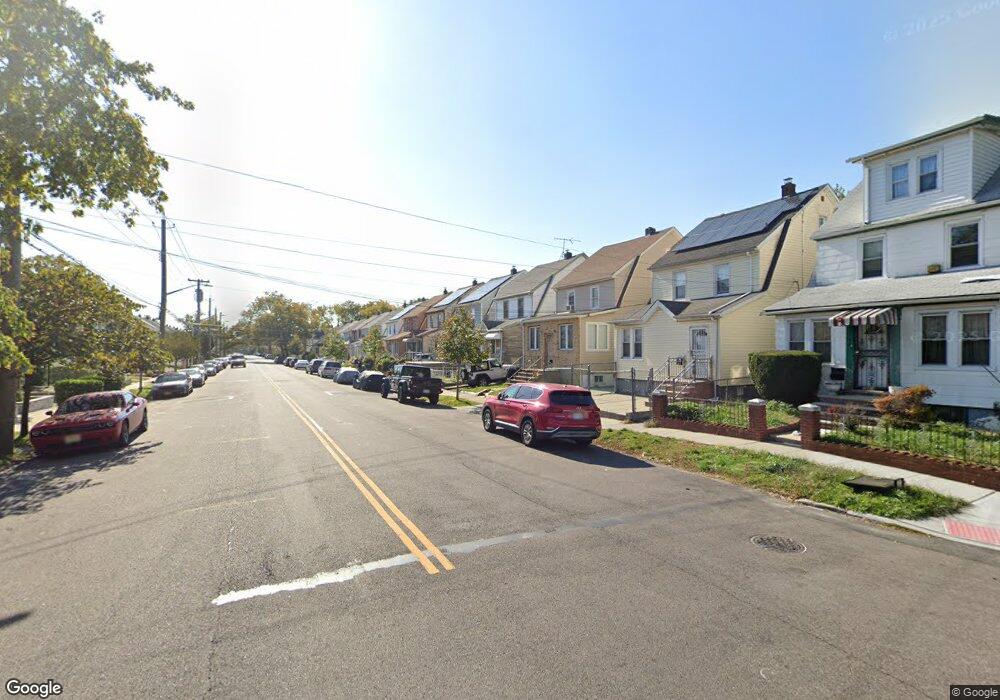
18835 Mangin Ave Saint Albans, NY 11412
Hollis NeighborhoodEstimated Value: $717,000 - $803,000
--
Bed
--
Bath
1,680
Sq Ft
$452/Sq Ft
Est. Value
About This Home
This home is located at 18835 Mangin Ave, Saint Albans, NY 11412 and is currently estimated at $759,879, approximately $452 per square foot. 18835 Mangin Ave is a home located in Queens County with nearby schools including P.S. 118 Lorraine Hansberry, I.S. 192 The Linden, and Riverton Street Charter School.
Ownership History
Date
Name
Owned For
Owner Type
Purchase Details
Closed on
Apr 1, 2016
Sold by
Power Sales Mangin 2 Corporation
Bought by
Venturina Carlo and Venturina Cristeta
Current Estimated Value
Home Financials for this Owner
Home Financials are based on the most recent Mortgage that was taken out on this home.
Original Mortgage
$471,306
Outstanding Balance
$373,932
Interest Rate
3.64%
Mortgage Type
Purchase Money Mortgage
Estimated Equity
$385,947
Purchase Details
Closed on
Nov 16, 2015
Sold by
Morales Jose
Bought by
Power Sales Mangin 2 Corporation
Purchase Details
Closed on
May 18, 2015
Sold by
146-29 Home Renovation Inc
Bought by
Morales Jose
Purchase Details
Closed on
Mar 17, 2014
Sold by
Morales Jose
Bought by
146-29 Home Renovation Inc
Purchase Details
Closed on
Mar 18, 1998
Sold by
Lincoln Equities Inc
Bought by
Morales Jose
Home Financials for this Owner
Home Financials are based on the most recent Mortgage that was taken out on this home.
Original Mortgage
$174,910
Interest Rate
6.98%
Mortgage Type
FHA
Purchase Details
Closed on
Dec 11, 1997
Sold by
Webster Ganathan
Bought by
Lincoln Equities Inc
Create a Home Valuation Report for This Property
The Home Valuation Report is an in-depth analysis detailing your home's value as well as a comparison with similar homes in the area
Home Values in the Area
Average Home Value in this Area
Purchase History
| Date | Buyer | Sale Price | Title Company |
|---|---|---|---|
| Venturina Carlo | $480,000 | -- | |
| Power Sales Mangin 2 Corporation | $190,000 | -- | |
| Morales Jose | -- | -- | |
| 146-29 Home Renovation Inc | -- | -- | |
| Morales Jose | $175,000 | -- | |
| Lincoln Equities Inc | $110,000 | Commonwealth Land Title Ins |
Source: Public Records
Mortgage History
| Date | Status | Borrower | Loan Amount |
|---|---|---|---|
| Open | Venturina Carlo | $471,306 | |
| Previous Owner | Morales Jose | $174,910 |
Source: Public Records
Tax History Compared to Growth
Tax History
| Year | Tax Paid | Tax Assessment Tax Assessment Total Assessment is a certain percentage of the fair market value that is determined by local assessors to be the total taxable value of land and additions on the property. | Land | Improvement |
|---|---|---|---|---|
| 2025 | $5,440 | $28,663 | $8,509 | $20,154 |
| 2024 | $3,866 | $27,086 | $8,213 | $18,873 |
| 2023 | $5,397 | $26,873 | $7,537 | $19,336 |
| 2022 | $3,552 | $35,280 | $11,880 | $23,400 |
| 2021 | $3,754 | $37,740 | $11,880 | $25,860 |
| 2020 | $5,056 | $34,620 | $11,880 | $22,740 |
| 2019 | $4,722 | $29,640 | $11,880 | $17,760 |
| 2018 | $4,565 | $22,394 | $10,608 | $11,786 |
| 2017 | $4,362 | $21,398 | $10,136 | $11,262 |
| 2016 | $4,218 | $21,398 | $10,136 | $11,262 |
| 2015 | $2,215 | $19,905 | $9,841 | $10,064 |
| 2014 | $2,215 | $18,810 | $11,154 | $7,656 |
Source: Public Records
Map
Nearby Homes
- 187-44 Jordan Ave
- 188-25 Mangin Ave
- 18823 Mangin Ave
- 188-07 Mangin Ave
- 186-16 Hilburn Ave
- 188-31 Jordan Ave
- 18833 Keeseville Ave
- 111-06 Farmers Blvd
- 19022 111th Rd
- 183-34 Fonda Ave
- 187-23 Brinkerhoff Ave
- 183-29 Brinkerhoff Ave
- 183-12 Elmira Ave
- 191-40 112th Rd
- 10533 Farmers Blvd
- 190-59 112th Ave
- 18908 114th Rd
- 190-63 112th Ave
- 183-67 Dunlop Ave
- 19027 109th Rd
- 18835 Mangin Ave
- 18831 Mangin Ave
- 18837 Mangin Ave
- 18831 Mangin Ave
- 18829 Mangin Ave
- 18841 Mangin Ave
- 18825 Mangin Ave
- 18843 Mangin Ave
- 18736 Jordan Ave
- 18740 Jordan Ave
- 18732 Jordan Ave
- 18847 Mangin Ave
- 18732 Jordan Ave
- 18744 Jordan Ave
- 187-32 Jordan Ave
- 18728 Jordan Ave
- 18819 Mangin Ave
- 18748 Jordan Ave
- 18836 Mangin Ave
- 18722 Jordan Ave