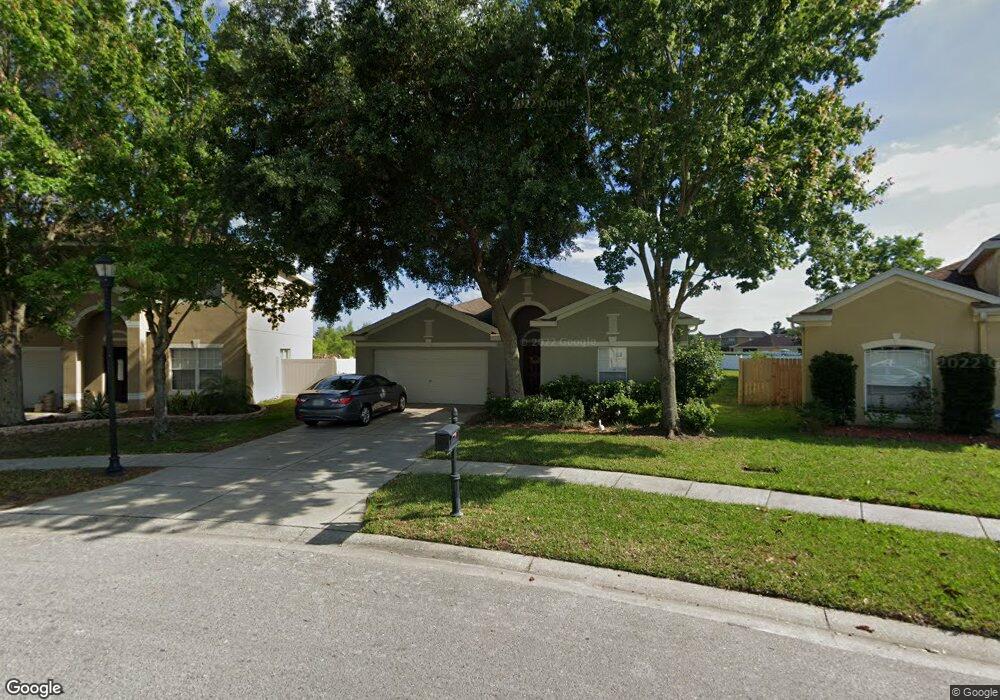
18846 Quarry Badger Rd Land O Lakes, FL 34638
Estimated Value: $333,880 - $365,000
3
Beds
2
Baths
2,425
Sq Ft
$144/Sq Ft
Est. Value
About This Home
This home is located at 18846 Quarry Badger Rd, Land O Lakes, FL 34638 and is currently estimated at $349,970, approximately $144 per square foot. 18846 Quarry Badger Rd is a home located in Pasco County with nearby schools including Connerton Elementary School, Pine View Middle School, and Land O' Lakes High School.
Ownership History
Date
Name
Owned For
Owner Type
Purchase Details
Closed on
Jan 26, 2018
Sold by
2018 1 Ih Borrower Lp
Bought by
2018 1 Iii Borrower Lp
Current Estimated Value
Purchase Details
Closed on
Apr 10, 2014
Sold by
Colfin A1-Fl 2 Llc
Bought by
Cah 2014-1 Borrower Llc
Purchase Details
Closed on
Mar 4, 2013
Sold by
Pham Thao D
Bought by
Colfin Ai Fl2 Llc
Purchase Details
Closed on
Sep 20, 2012
Sold by
Pham Thao D
Bought by
Asbel Creek Association Inc
Purchase Details
Closed on
Mar 22, 2005
Sold by
The Ryland Group Inc
Bought by
Pham Thao D
Home Financials for this Owner
Home Financials are based on the most recent Mortgage that was taken out on this home.
Original Mortgage
$171,100
Interest Rate
5.75%
Mortgage Type
Purchase Money Mortgage
Create a Home Valuation Report for This Property
The Home Valuation Report is an in-depth analysis detailing your home's value as well as a comparison with similar homes in the area
Home Values in the Area
Average Home Value in this Area
Purchase History
| Date | Buyer | Sale Price | Title Company |
|---|---|---|---|
| 2018 1 Iii Borrower Lp | -- | Attorney | |
| Cah 2014-1 Borrower Llc | -- | None Available | |
| Colfin Ai Fl2 Llc | $105,800 | Attorney | |
| Asbel Creek Association Inc | -- | Attorney | |
| Pham Thao D | $190,140 | Ryland Title Company |
Source: Public Records
Mortgage History
| Date | Status | Borrower | Loan Amount |
|---|---|---|---|
| Previous Owner | Pham Thao D | $171,100 |
Source: Public Records
Tax History Compared to Growth
Tax History
| Year | Tax Paid | Tax Assessment Tax Assessment Total Assessment is a certain percentage of the fair market value that is determined by local assessors to be the total taxable value of land and additions on the property. | Land | Improvement |
|---|---|---|---|---|
| 2025 | $4,932 | $286,037 | $63,729 | $222,308 |
| 2024 | $4,932 | $300,150 | $63,729 | $236,421 |
| 2023 | $4,703 | $306,025 | $49,869 | $256,156 |
| 2022 | $3,879 | $259,894 | $41,904 | $217,990 |
| 2021 | $3,366 | $195,363 | $33,631 | $161,732 |
| 2020 | $3,175 | $183,637 | $27,762 | $155,875 |
| 2019 | $3,079 | $176,170 | $27,762 | $148,408 |
| 2018 | $2,944 | $167,563 | $27,762 | $139,801 |
| 2017 | $2,764 | $158,736 | $27,762 | $130,974 |
| 2016 | $2,532 | $144,999 | $27,762 | $117,237 |
| 2015 | $2,311 | $123,996 | $27,762 | $96,234 |
| 2014 | $2,105 | $114,455 | $27,312 | $87,143 |
Source: Public Records
Map
Nearby Homes
- 9613 Jasmine Brook Cir
- 18901 New Passage Blvd
- 9840 Jasmine Brook Cir
- 9954 Jasmine Brook Cir
- 9711 Simeon Dr
- 9706 Simeon Dr
- 10047 Landport Way
- 9863 Asbel Estates St
- 18929 Parapet Place
- 9645 Jaybird Ln
- 18439 Red Willow Way
- 9551 Jaybird Ln
- 10271 Hawks Landing Dr
- 19017 Sunterra Dr
- 18446 Hunters Meadow Walk
- 10567 Heron Hideaway Loop
- 10328 Hawks Landing Dr
- 18930 Narimore Dr
- 10497 Heron Hideaway Loop
- 9329 Wellstone Dr
- 18850 Quarry Badger Rd
- 18842 Quarry Badger Rd
- 18854 Quarry Badger Rd
- 18838 Quarry Badger Rd
- 18851 Quarry Badger Rd
- 18908 Quarry Badger Rd
- 18834 Quarry Badger Rd
- 18828 Quarry Badger Rd
- 18914 Quarry Badger Rd
- 18907 Quarry Badger Rd
- 18911 Quarry Badger Rd
- 18822 Road
- 18842 New Passage Blvd
- 18920 Quarry Badger Rd
- 18848 New Passage Blvd
- 18915 Quarry Badger Rd
- 9631 Jasmine Brook Cir
- 9637 Jasmine Brook Cir