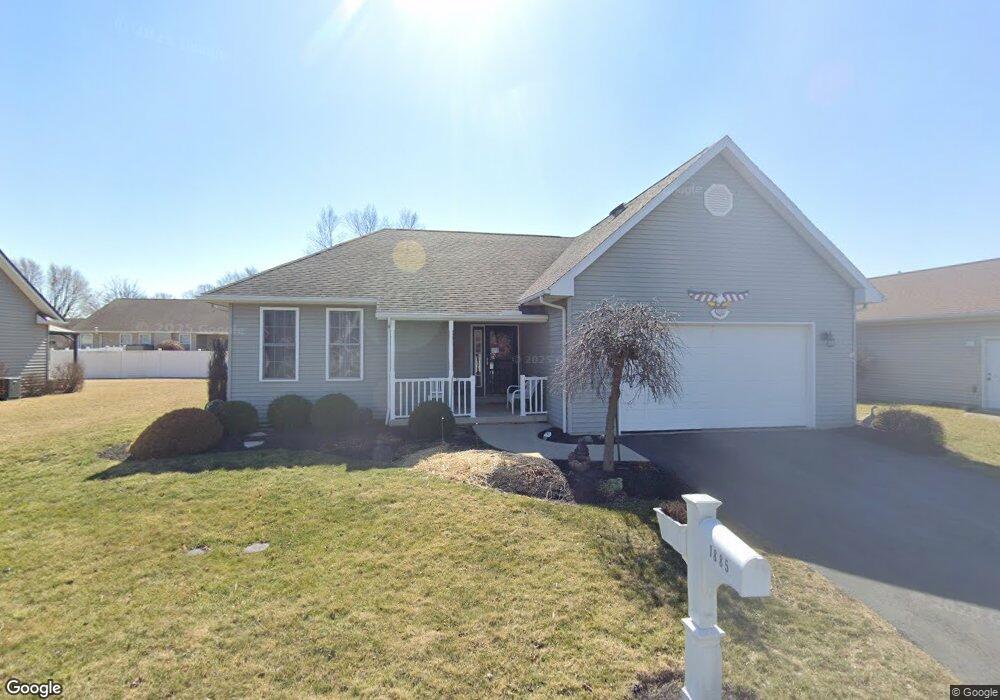
1885 Baker Way Unit 16 Findlay, OH 45840
Estimated Value: $238,000 - $287,000
3
Beds
3
Baths
1,365
Sq Ft
$188/Sq Ft
Est. Value
About This Home
This home is located at 1885 Baker Way Unit 16, Findlay, OH 45840 and is currently estimated at $256,779, approximately $188 per square foot. 1885 Baker Way Unit 16 is a home located in Hancock County with nearby schools including Chamberlin Hill Elementary School, Jefferson Elementary School, and Donnell Middle School.
Ownership History
Date
Name
Owned For
Owner Type
Purchase Details
Closed on
Oct 22, 2010
Sold by
Hill Dale F and Hill Kay A
Bought by
Hill Dale F and Hill Kay A
Current Estimated Value
Purchase Details
Closed on
Nov 14, 2007
Sold by
Bodle Patrick R and Bodle Janell M
Bought by
Hill Dale F and Hill Kay A
Home Financials for this Owner
Home Financials are based on the most recent Mortgage that was taken out on this home.
Original Mortgage
$153,000
Outstanding Balance
$96,404
Interest Rate
6.3%
Mortgage Type
Purchase Money Mortgage
Estimated Equity
$160,375
Purchase Details
Closed on
Jul 29, 2005
Sold by
Hermiller Construction Inc
Bought by
Bodle Patrick R
Home Financials for this Owner
Home Financials are based on the most recent Mortgage that was taken out on this home.
Original Mortgage
$140,000
Interest Rate
6%
Mortgage Type
Purchase Money Mortgage
Create a Home Valuation Report for This Property
The Home Valuation Report is an in-depth analysis detailing your home's value as well as a comparison with similar homes in the area
Home Values in the Area
Average Home Value in this Area
Purchase History
| Date | Buyer | Sale Price | Title Company |
|---|---|---|---|
| Hill Dale F | -- | Attorney | |
| Hill Dale F | $153,000 | Golden Key Title | |
| Bodle Patrick R | $140,000 | Assured Title Agency | |
| Hermiller Construction Inc | $23,500 | Assured Title Agency |
Source: Public Records
Mortgage History
| Date | Status | Borrower | Loan Amount |
|---|---|---|---|
| Open | Hill Dale F | $153,000 | |
| Previous Owner | Bodle Patrick R | $140,000 |
Source: Public Records
Tax History Compared to Growth
Tax History
| Year | Tax Paid | Tax Assessment Tax Assessment Total Assessment is a certain percentage of the fair market value that is determined by local assessors to be the total taxable value of land and additions on the property. | Land | Improvement |
|---|---|---|---|---|
| 2024 | $2,170 | $61,100 | $2,800 | $58,300 |
| 2023 | $2,174 | $61,100 | $2,800 | $58,300 |
| 2022 | $2,166 | $61,100 | $2,800 | $58,300 |
| 2021 | $2,165 | $53,190 | $2,100 | $51,090 |
| 2020 | $2,165 | $53,190 | $2,100 | $51,090 |
| 2019 | $2,121 | $53,190 | $2,100 | $51,090 |
| 2018 | $1,868 | $42,980 | $2,100 | $40,880 |
| 2017 | $934 | $42,980 | $2,100 | $40,880 |
| 2016 | $1,845 | $42,980 | $2,100 | $40,880 |
| 2015 | $1,980 | $45,280 | $2,100 | $43,180 |
| 2014 | $1,980 | $45,280 | $2,100 | $43,180 |
| 2012 | $2,073 | $47,080 | $2,100 | $44,980 |
Source: Public Records
Map
Nearby Homes
- 1604 Payne Ave
- 0 Bushwillow Dr Unit Lot 154
- 0 Bushwillow Dr Lot 156 Unit 6079046
- 0 Rock Candy Rd Lot 162 Unit 6079070
- 0 Bushwillow Dr Unit Lot 156
- 0 Bearcat Way Or 0 Rock Candy Rd Lot 167 Unit 6079083
- 0 Bushwillow Dr Lot 154 Unit 6079043
- 0 Rock Candy Rd Lot 171 Unit 6079088
- 0 County Road 99 Lot 2 Unit 6081480
- 0 Rock Candy Rd Lot 159 Unit 6079053
- 0 Bushwillow Dr Or Rock Candy Rd Lot 157 Unit 6079052
- 0 Bushwillow Dr Unit Lot 155
- 0 Rock Candy Rd Or Bushwillow Dr Lot 173 Unit 6079093
- 0 Rock Candy Rd Lot 168 Unit 6079085
- 0 Rock Candy Rd Lot 170 Unit 6079087
- 0 Bushwillow Dr Lot 155 Unit 6079044
- 10601 County Road 9
- 0 Waterford Way Lot 78 Unit 6089639
- 9653 Early Dr
- 9307 Hiegel Dr
- 1888 Baker Way Unit 19
- 1895 Baker Way Unit 15
- 1875 Baker Way Unit 17
- 1898 Baker Way Unit 18
- 1878 Baker Way Unit 20
- 1888 Eggleston Dr Unit 9
- 1898 Eggleston Dr Unit 8
- 1878 Eggleston Ave
- 1878 Eggleston Dr Unit 10
- 1898 Eggleston Ave
- 1965 Jamie Dr Unit 11
- 1955 Jamie Dr Unit 12
- 1975 Jamie Dr Unit 7
- 1885 Jessica Dr Unit 28
- 1885 Eggleston Dr Unit 2
- 1945 Jamie Dr
- 1895 Eggleston Dr Unit 1
- 1895 Jessica Dr Unit 27
- 1985 Jamie Dr
- 1875 Eggleston Dr Unit 3