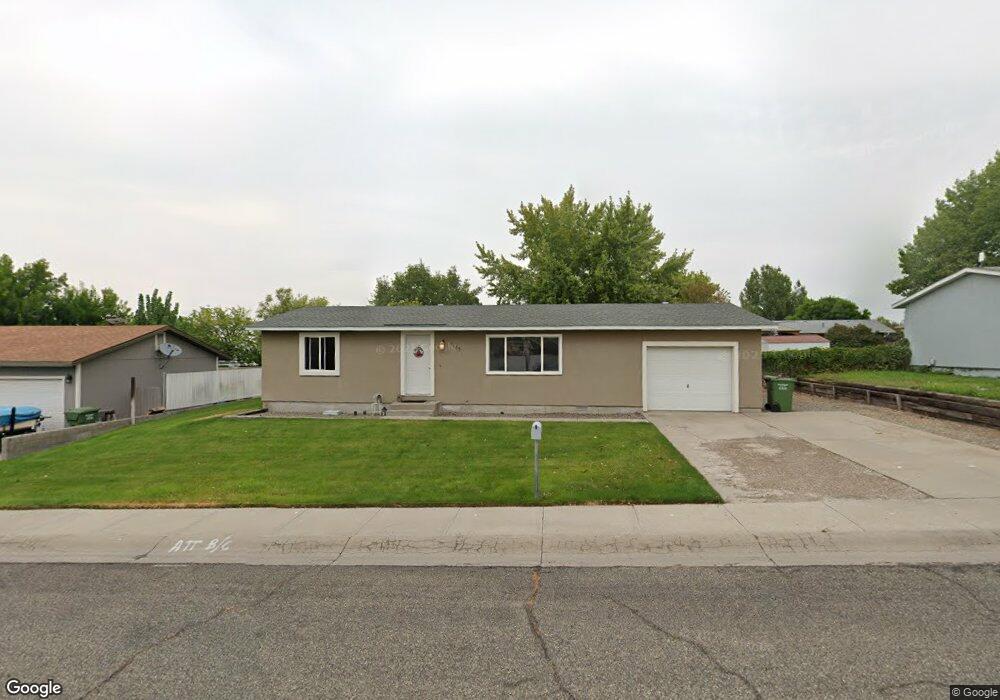
1885 Case St Winnemucca, NV 89445
Estimated Value: $276,403 - $288,000
2
Beds
1
Bath
960
Sq Ft
$296/Sq Ft
Est. Value
About This Home
This home is located at 1885 Case St, Winnemucca, NV 89445 and is currently estimated at $284,101, approximately $295 per square foot. 1885 Case St is a home located in Humboldt County with nearby schools including Sonoma Heights Elementary School, French Ford Middle School, and Winnemucca Junior High School.
Ownership History
Date
Name
Owned For
Owner Type
Purchase Details
Closed on
Jul 25, 2016
Sold by
Qpsm Llc
Bought by
Quilici Mike and Quilici Susan
Current Estimated Value
Home Financials for this Owner
Home Financials are based on the most recent Mortgage that was taken out on this home.
Original Mortgage
$116,250
Interest Rate
3.48%
Mortgage Type
New Conventional
Purchase Details
Closed on
Nov 16, 2012
Sold by
Quilici Mike and Quilici Susan
Bought by
Qpsm Llc
Purchase Details
Closed on
Aug 22, 2005
Sold by
Quilici Michael and Quilici Susan
Bought by
Quilici Michael and Quilici Susan
Purchase Details
Closed on
Apr 28, 2005
Sold by
Jlm Title Llc
Bought by
Quilici Michael and Quilici Susan
Create a Home Valuation Report for This Property
The Home Valuation Report is an in-depth analysis detailing your home's value as well as a comparison with similar homes in the area
Home Values in the Area
Average Home Value in this Area
Purchase History
| Date | Buyer | Sale Price | Title Company |
|---|---|---|---|
| Quilici Mike | $135,000 | Western Title Company | |
| Qpsm Llc | -- | None Available | |
| Quilici Michael | -- | Western Title | |
| Quilici Michael | $65,200 | First Centennial Title Compa |
Source: Public Records
Mortgage History
| Date | Status | Borrower | Loan Amount |
|---|---|---|---|
| Previous Owner | Quilici Mike | $116,250 |
Source: Public Records
Tax History Compared to Growth
Tax History
| Year | Tax Paid | Tax Assessment Tax Assessment Total Assessment is a certain percentage of the fair market value that is determined by local assessors to be the total taxable value of land and additions on the property. | Land | Improvement |
|---|---|---|---|---|
| 2025 | $1,084 | $29,843 | $11,200 | $18,643 |
| 2024 | $1,033 | $30,250 | $11,200 | $19,050 |
| 2023 | $1,033 | $27,489 | $9,275 | $18,214 |
| 2022 | $901 | $25,009 | $9,275 | $15,734 |
| 2021 | $906 | $25,158 | $9,275 | $15,883 |
| 2020 | $924 | $25,736 | $9,275 | $16,461 |
| 2019 | $913 | $25,384 | $9,275 | $16,109 |
| 2018 | $908 | $25,228 | $9,275 | $15,953 |
| 2017 | $915 | $25,436 | $9,275 | $16,161 |
| 2016 | $933 | $26,435 | $9,275 | $17,160 |
| 2015 | $1,005 | $26,453 | $9,275 | $17,178 |
| 2014 | $1,005 | $26,346 | $9,275 | $17,071 |
Source: Public Records
Map
Nearby Homes
- 240 Circle Dr
- 273 Mccoy St
- 5270 Marla Dr Unit 14
- 702 W Mcarthur Ave Unit 56
- 702 W Mcarthur Ave Unit 82
- 1385 S Bridge St
- 253 N Highland Dr
- 20 Julie Ct
- 0 Julie Ct
- 5198 Western Way
- Lot 16059313 Offenhauser Dr
- Lot 16059212 Offenhauser Dr
- Lot 16059312 Offenhauser Dr
- Lot 16059303 Offenhauser Dr
- Lot 16059209 Offenhauser Dr
- Lot 16059217 Offenhauser Dr
- Lot 16059301 Offenhauser Dr
- Lot 16059211 Offenhauser Dr
- Lot 16059305 Offenhauser Dr
- Lot 16059309 Offenhauser Dr