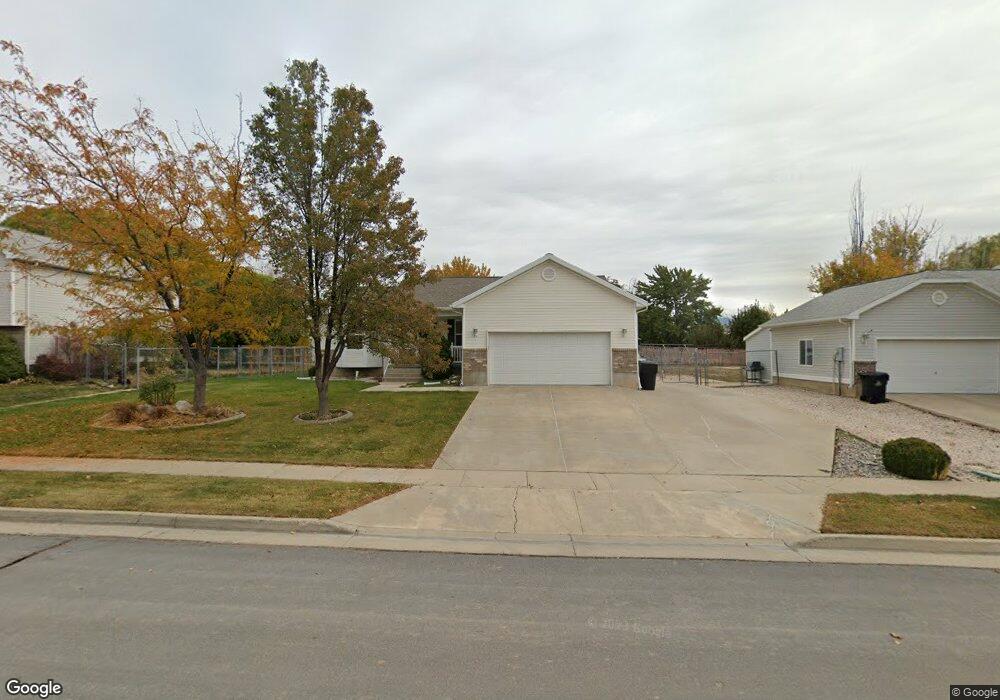
1885 Dahl Ln Unit 28 Syracuse, UT 84075
Estimated Value: $481,000 - $563,075
3
Beds
2
Baths
2,569
Sq Ft
$208/Sq Ft
Est. Value
About This Home
This home is located at 1885 Dahl Ln Unit 28, Syracuse, UT 84075 and is currently estimated at $534,269, approximately $207 per square foot. 1885 Dahl Ln Unit 28 is a home located in Davis County with nearby schools including Cook School, Syracuse Junior High School, and Syracuse High School.
Ownership History
Date
Name
Owned For
Owner Type
Purchase Details
Closed on
Oct 13, 2014
Sold by
Suzanne Belnap Cheney Family Protection and Cheney Suzanne Belnap
Bought by
Cheney Duane Dee and Cheney Suzanne
Current Estimated Value
Purchase Details
Closed on
Sep 25, 2013
Sold by
Anderson John M and Anderson Kelli C
Bought by
Suzanne Belnap Cheney Family Protection and Cheney Suzanne Belnap
Purchase Details
Closed on
Jun 19, 1998
Sold by
Wl Homes Llc
Bought by
Anderson John M and Anderson Kelli C
Home Financials for this Owner
Home Financials are based on the most recent Mortgage that was taken out on this home.
Original Mortgage
$116,550
Interest Rate
7.11%
Purchase Details
Closed on
Apr 8, 1998
Sold by
Watt Residential Partners
Bought by
Wl Homes Llc
Create a Home Valuation Report for This Property
The Home Valuation Report is an in-depth analysis detailing your home's value as well as a comparison with similar homes in the area
Home Values in the Area
Average Home Value in this Area
Purchase History
| Date | Buyer | Sale Price | Title Company |
|---|---|---|---|
| Cheney Duane Dee | -- | Founders Title Co | |
| Suzanne Belnap Cheney Family Protection | -- | Founders Title Co | |
| Anderson John M | -- | First American Title Co | |
| Wl Homes Llc | -- | Founders Title Co |
Source: Public Records
Mortgage History
| Date | Status | Borrower | Loan Amount |
|---|---|---|---|
| Previous Owner | Anderson John M | $116,550 |
Source: Public Records
Tax History Compared to Growth
Tax History
| Year | Tax Paid | Tax Assessment Tax Assessment Total Assessment is a certain percentage of the fair market value that is determined by local assessors to be the total taxable value of land and additions on the property. | Land | Improvement |
|---|---|---|---|---|
| 2025 | $3,067 | $295,900 | $127,953 | $167,947 |
| 2024 | $2,910 | $282,700 | $108,737 | $173,963 |
| 2023 | $2,712 | $480,000 | $151,343 | $328,657 |
| 2022 | $2,942 | $285,450 | $86,715 | $198,735 |
| 2021 | $2,617 | $393,000 | $128,479 | $264,521 |
| 2020 | $2,352 | $342,000 | $110,452 | $231,548 |
| 2019 | $2,278 | $327,000 | $109,759 | $217,241 |
| 2018 | $2,098 | $299,000 | $105,034 | $193,966 |
| 2016 | $1,916 | $143,165 | $40,248 | $102,917 |
| 2015 | $1,852 | $131,780 | $40,248 | $91,532 |
| 2014 | $1,879 | $136,287 | $40,248 | $96,039 |
| 2013 | -- | $116,038 | $33,416 | $82,622 |
Source: Public Records
Map
Nearby Homes