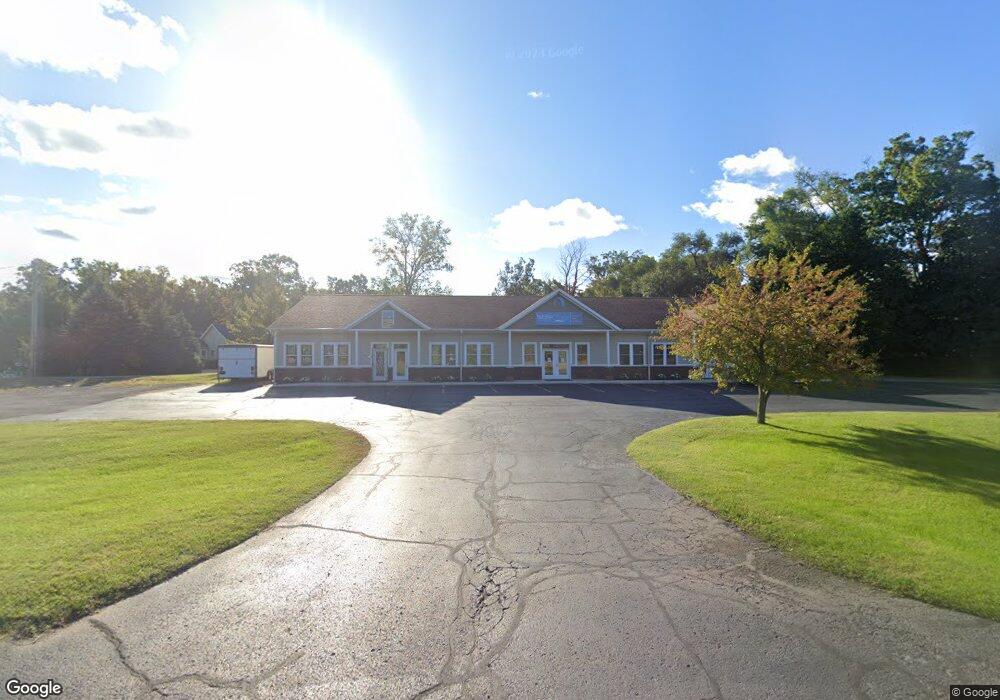
18853 U S 12 Unit A-2 New Buffalo, MI 49117
Estimated Value: $1,391,743
--
Bed
--
Bath
6,480
Sq Ft
$215/Sq Ft
Est. Value
About This Home
This home is located at 18853 U S 12 Unit A-2, New Buffalo, MI 49117 and is currently estimated at $1,391,743, approximately $214 per square foot. 18853 U S 12 Unit A-2 is a home located in Berrien County with nearby schools including New Buffalo Elementary School, New Buffalo Middle School, and New Buffalo Senior High School.
Ownership History
Date
Name
Owned For
Owner Type
Purchase Details
Closed on
Nov 14, 2017
Sold by
Howard Willie Clay and Howard C W
Bought by
Premiere Milton
Current Estimated Value
Purchase Details
Closed on
Jul 31, 2007
Sold by
Horizon Bank Na
Bought by
Howard W C
Purchase Details
Closed on
Feb 2, 2006
Sold by
Glossinger James H and Glossinger Sara A
Bought by
Horizon Bank and Alliance Banking Co
Purchase Details
Closed on
Jul 19, 2004
Sold by
Glossinger James H and Glossinger Sara A
Bought by
Glossinger James H and Glossinger Sara A
Home Financials for this Owner
Home Financials are based on the most recent Mortgage that was taken out on this home.
Original Mortgage
$151,000
Interest Rate
6.34%
Mortgage Type
New Conventional
Purchase Details
Closed on
Apr 15, 2004
Sold by
Glossinger James H and Glossinger Sara A
Bought by
Alliance Banking Co
Create a Home Valuation Report for This Property
The Home Valuation Report is an in-depth analysis detailing your home's value as well as a comparison with similar homes in the area
Home Values in the Area
Average Home Value in this Area
Purchase History
| Date | Buyer | Sale Price | Title Company |
|---|---|---|---|
| Premiere Milton | -- | None Available | |
| Howard W C | -- | Metropolitan Title | |
| Horizon Bank | $120,007 | None Available | |
| Glossinger James H | -- | -- | |
| Alliance Banking Co | $96,611 | -- |
Source: Public Records
Mortgage History
| Date | Status | Borrower | Loan Amount |
|---|---|---|---|
| Previous Owner | Glossinger James H | $151,000 |
Source: Public Records
Tax History Compared to Growth
Tax History
| Year | Tax Paid | Tax Assessment Tax Assessment Total Assessment is a certain percentage of the fair market value that is determined by local assessors to be the total taxable value of land and additions on the property. | Land | Improvement |
|---|---|---|---|---|
| 2025 | $7,379 | $370,600 | $0 | $0 |
| 2024 | $4,733 | $414,100 | $0 | $0 |
| 2023 | $4,508 | $352,700 | $0 | $0 |
| 2022 | $7,661 | $319,000 | $0 | $0 |
| 2021 | $11,602 | $302,100 | $20,100 | $282,000 |
| 2020 | $11,297 | $299,600 | $0 | $0 |
| 2019 | $11,175 | $292,500 | $20,100 | $272,400 |
| 2018 | $10,294 | $284,400 | $0 | $0 |
| 2017 | $8,139 | $344,100 | $0 | $0 |
| 2016 | $7,618 | $359,200 | $0 | $0 |
| 2015 | $7,587 | $310,000 | $0 | $0 |
| 2014 | $4,688 | $285,900 | $0 | $0 |
Source: Public Records
Map
Nearby Homes
- 13178 Fedde Ave
- 51323 Erich Ln
- 52300 E Arnold Dr
- 18734 Leonard Ct
- 13078 Fedde Ave
- 18790 Park View Dr
- 51111 Main Dr
- 18774 Old Field Rd
- 18654 Oldfield Rd
- 19253 White Pine Dr Unit 2
- 52300 E Arnold - Land Dr
- 13254 Wilson Rd
- 50005 High Point Ln
- 49209 Howard Ave
- 49106 Sun Valley Falls Blvd
- 49005 E Mckean Dr
- 48020 Ridge Rd
- 19409 U S 12
- 48102 W Mckean Dr
- 200 Marx Dr
- 18853 U S 12 Unit A-4
- 18853 U S 12 Unit A
- 18853 U S 12 Unit A-3
- 18853 U S 12 Unit A-1
- 18853 U S 12
- 13262 Fedde Ave
- 13240 Fedde Ave
- 13273 Lubke Rd
- 13287 Lubke Rd
- 13253 Lubke Rd
- 19125 U S 12
- 13261 Fedde Ave
- 0 Fedde
- 13221 Lubke Rd
- 13256 Lubke Rd
- 13264 Yunge Ave
- 13217 Fedde Ave
- 13240 Lubke Rd
- 13199 Fedde Ave
- 13228 Lubke Rd